
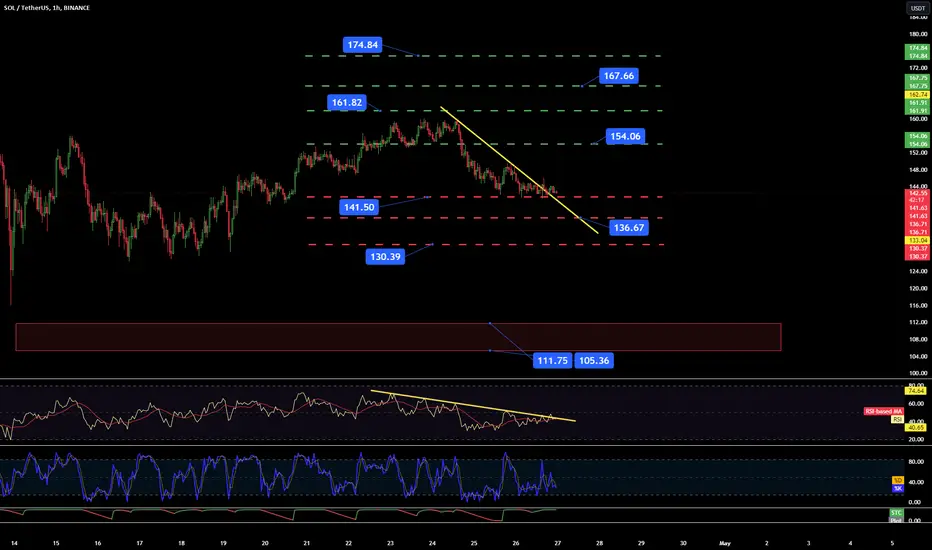
Hello everyone, let's look at the 1H SOL to USDT chart, as we can see the price has entered a sideways movement and is breaking sideways from the local downtrend line.
Let's start by setting goals for the near future that we can include:
T1 = $154
T2 = $162
T3 = $168
AND
T4 = $175
Now let's move on to the stop-loss in case of further market declines:
SL1 = $142
SL2 = $137
SL3 = $130
AND
SL4 = $112 - $105
When we look at the RSI indicator, we will see that we are bouncing off the downward trend line, but we can see that the lateral price movement results in an increase in the indicator, which may again translate into an attempt to drop the price.
Let's start by setting goals for the near future that we can include:
T1 = $154
T2 = $162
T3 = $168
AND
T4 = $175
Now let's move on to the stop-loss in case of further market declines:
SL1 = $142
SL2 = $137
SL3 = $130
AND
SL4 = $112 - $105
When we look at the RSI indicator, we will see that we are bouncing off the downward trend line, but we can see that the lateral price movement results in an increase in the indicator, which may again translate into an attempt to drop the price.

免责声明
这些信息和出版物并非旨在提供,也不构成TradingView提供或认可的任何形式的财务、投资、交易或其他类型的建议或推荐。请阅读使用条款了解更多信息。
免责声明
这些信息和出版物并非旨在提供,也不构成TradingView提供或认可的任何形式的财务、投资、交易或其他类型的建议或推荐。请阅读使用条款了解更多信息。