
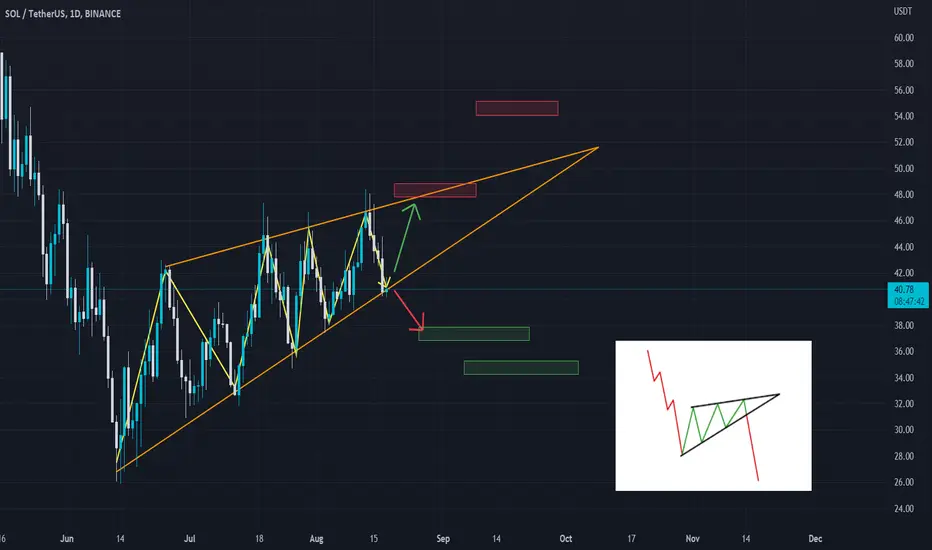
SOL/USDT is making a rising wedge pattern on 1 day chart.
There can be 2 scenarios:
1. If SOL breakout through the lower trend line below 40 then the targets are on next support areas marked on the chart (Green)
2. If SOL holds the area in the wedge then the targets are on next resistance areas marked on the chart (Red)
Share your views in the comment section.
Like & follow for more easy and simple trading ideas.
Thank You!
There can be 2 scenarios:
1. If SOL breakout through the lower trend line below 40 then the targets are on next support areas marked on the chart (Green)
2. If SOL holds the area in the wedge then the targets are on next resistance areas marked on the chart (Red)
Share your views in the comment section.
Like & follow for more easy and simple trading ideas.
Thank You!
交易结束:到达目标
SOL closed the candle below the trend line around 23:15 UTC (18 Aug), & 1st scenario initiated.Both the targets from downward movement were achieved.
That was a sharp trade, achieving its target points really quickly.
Don't forget to like & follow for more.

免责声明
这些信息和出版物并非旨在提供,也不构成TradingView提供或认可的任何形式的财务、投资、交易或其他类型的建议或推荐。请阅读使用条款了解更多信息。
免责声明
这些信息和出版物并非旨在提供,也不构成TradingView提供或认可的任何形式的财务、投资、交易或其他类型的建议或推荐。请阅读使用条款了解更多信息。