
Hi Folks,
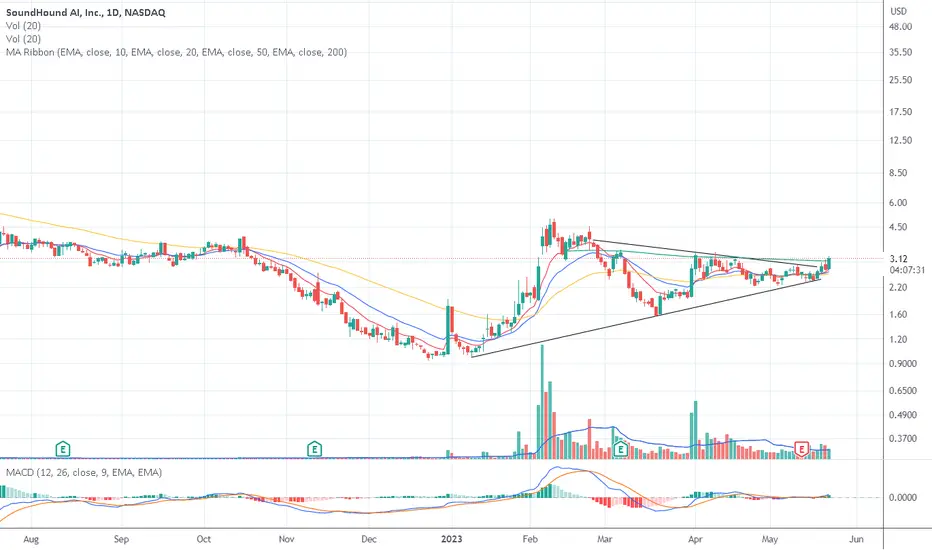
SOUNDHOUND SOUN presents a quite interesting chart pattern.
• A big move in the past 1-3 months anywhere from 30%-100% the rally last for a few days to weeks.
• Stock is above ema 200
• Orderly consolidation with higher lows & tightening range:
• RDM, VCP
• Stocks surfs the rising EMA 10 or the EMA 20, and sometimes the EMA 50
• Volumes are significative compared to previous phase
• Volumes dry up at the end of the consolidation
• Volumes are strong during the breakout
• ADR is high
Does it also "Sounds" good to you ?
SOUNDHOUND SOUN presents a quite interesting chart pattern.
• A big move in the past 1-3 months anywhere from 30%-100% the rally last for a few days to weeks.
• Stock is above ema 200
• Orderly consolidation with higher lows & tightening range:
• RDM, VCP
• Stocks surfs the rising EMA 10 or the EMA 20, and sometimes the EMA 50
• Volumes are significative compared to previous phase
• Volumes dry up at the end of the consolidation
• Volumes are strong during the breakout
• ADR is high
Does it also "Sounds" good to you ?

免责声明
这些信息和出版物并非旨在提供,也不构成TradingView提供或认可的任何形式的财务、投资、交易或其他类型的建议或推荐。请阅读使用条款了解更多信息。
免责声明
这些信息和出版物并非旨在提供,也不构成TradingView提供或认可的任何形式的财务、投资、交易或其他类型的建议或推荐。请阅读使用条款了解更多信息。