
A) The Liquidity Regime (Tier 1 & 2)
The technical breakout on the S&P 500 (SPX) is currently being underwritten by a structural shift in U.S. liquidity conditions:
• TGA & Net Liquidity:
As of May 9, 2026, the Treasury General Account (TGA) has stabilized near $860.29B. Any drawdown from this level acts as a direct injection of liquidity into the banking system, fueling continued demand for equities.
• DXY Pressure:
The U.S. Dollar Index (DXY) is currently below the 98.00 level. A weaker dollar reduces discount-rate pressure on risk assets, acting as a hidden tailwind for equity expansion.
• VIX Context:
With the VIX near 17.19, systemic fear remains low. This supports a risk-on environment where trend-following dominates over defensive positioning.
---
B) Volume Footprint & Absorption (Execution Edge)
We observe clear institutional behavior through volume structure:
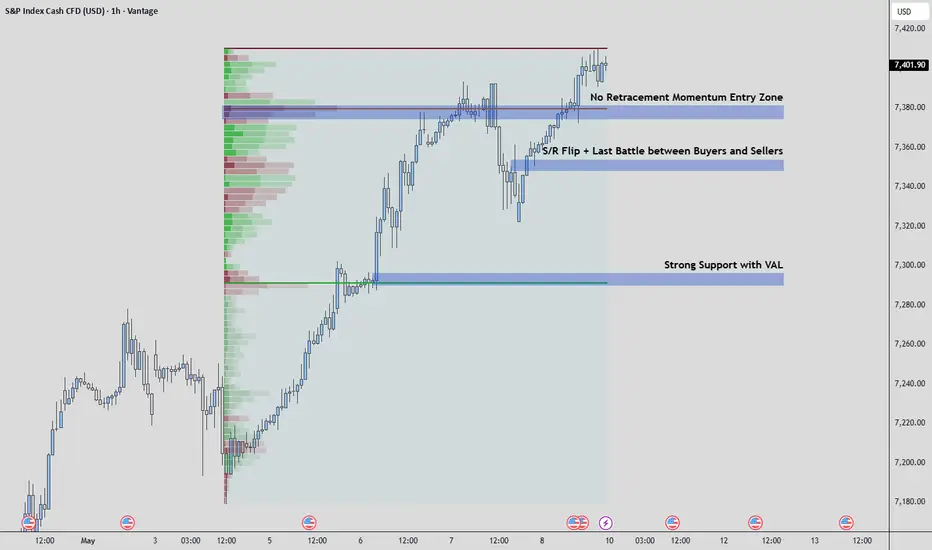
• Strong Support / Value Area Low (VAL):
The lower volume node acted as the first line of defense. Price reaction here shows passive buyers absorbing aggressive sell-side flow.
• S/R Flip Zone ("Last Battle"):
The $7,355 region represents a key structural pivot. Sellers attempted to reclaim control but were fully absorbed by aggressive institutional buying. Once this level was defended, it flipped into strong structural support.
• No Retracement Momentum Zone:
Price is holding above the breakout zone without meaningful pullback. This indicates seller exhaustion and continued demand dominance.
---
C) Trade Setup & Risk Management
• Entry Strategy:
Monitor the $7,380 zone for continued absorption. The ideal signal is small aggressive selling that fails to move price lower (the "sponge effect").
• Target:
Liquidity highs above $7,410.
• Invalidation:
A 1H close below $7,350 invalidates the bullish structure and suggests a short-term shift in liquidity conditions.
---
Macro-Technical Correlation Summary
• DXY (97.90): Bullish for equities (liquidity expansion)
• VIX (17.19): Risk-on environment supports trend continuation
• TGA (~$860B): Neutral-to-positive, watch for drawdowns (liquidity injection potential)
• Footprint Delta: Positive, confirming institutional accumulation
---
Easy-to-Understand Relation: The "Wall of Money"
Think of global liquidity as a rising tide.
When the DXY falls, the tide rises and lifts all risk assets. The blue zones on the chart act like anchors, institutional buyers positioned at $7,350–$7,380.
As long as these anchors hold, the path of least resistance remains upward, because every dip is absorbed rather than allowed to develop into a reversal.
The technical breakout on the S&P 500 (SPX) is currently being underwritten by a structural shift in U.S. liquidity conditions:
• TGA & Net Liquidity:
As of May 9, 2026, the Treasury General Account (TGA) has stabilized near $860.29B. Any drawdown from this level acts as a direct injection of liquidity into the banking system, fueling continued demand for equities.
• DXY Pressure:
The U.S. Dollar Index (DXY) is currently below the 98.00 level. A weaker dollar reduces discount-rate pressure on risk assets, acting as a hidden tailwind for equity expansion.
• VIX Context:
With the VIX near 17.19, systemic fear remains low. This supports a risk-on environment where trend-following dominates over defensive positioning.
---
B) Volume Footprint & Absorption (Execution Edge)
We observe clear institutional behavior through volume structure:
• Strong Support / Value Area Low (VAL):
The lower volume node acted as the first line of defense. Price reaction here shows passive buyers absorbing aggressive sell-side flow.
• S/R Flip Zone ("Last Battle"):
The $7,355 region represents a key structural pivot. Sellers attempted to reclaim control but were fully absorbed by aggressive institutional buying. Once this level was defended, it flipped into strong structural support.
• No Retracement Momentum Zone:
Price is holding above the breakout zone without meaningful pullback. This indicates seller exhaustion and continued demand dominance.
---
C) Trade Setup & Risk Management
• Entry Strategy:
Monitor the $7,380 zone for continued absorption. The ideal signal is small aggressive selling that fails to move price lower (the "sponge effect").
• Target:
Liquidity highs above $7,410.
• Invalidation:
A 1H close below $7,350 invalidates the bullish structure and suggests a short-term shift in liquidity conditions.
---
Macro-Technical Correlation Summary
• DXY (97.90): Bullish for equities (liquidity expansion)
• VIX (17.19): Risk-on environment supports trend continuation
• TGA (~$860B): Neutral-to-positive, watch for drawdowns (liquidity injection potential)
• Footprint Delta: Positive, confirming institutional accumulation
---
Easy-to-Understand Relation: The "Wall of Money"
Think of global liquidity as a rising tide.
When the DXY falls, the tide rises and lifts all risk assets. The blue zones on the chart act like anchors, institutional buyers positioned at $7,350–$7,380.
As long as these anchors hold, the path of least resistance remains upward, because every dip is absorbed rather than allowed to develop into a reversal.

免责声明
这些信息和出版物并非旨在提供,也不构成TradingView提供或认可的任何形式的财务、投资、交易或其他类型的建议或推荐。请阅读使用条款了解更多信息。