
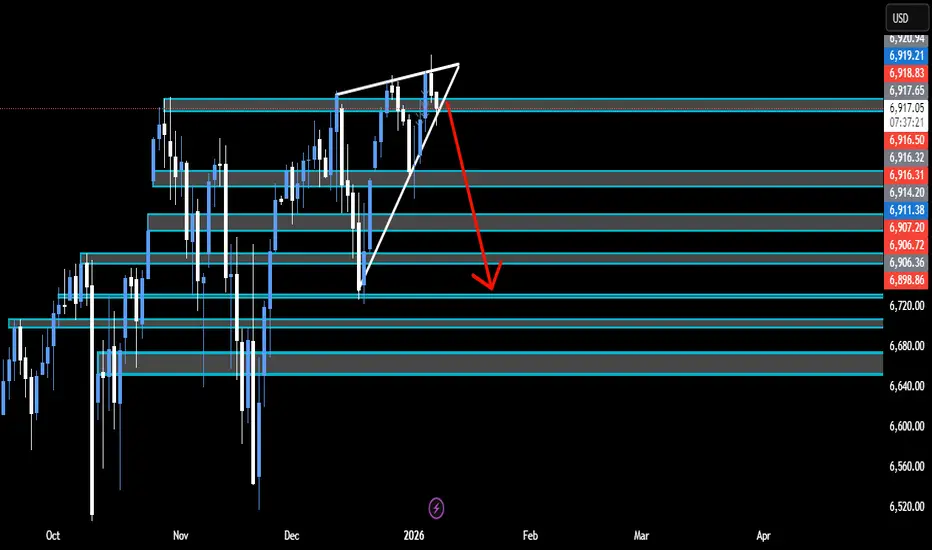
Daily Time Frame- Rising Wedge is a bearish reversal pattern. If the Daily breaks out of this pattern at any point towards the downside we should see price reach the previous support levels around 6840.00.
4H Time Frame- Created Bearish Divergence on the Relative Strength Index indicator (RSI). Higher highs are being made in price but lower highs on indicator.
1H time Frame and down has a head and shoulders pattern. Currently sitting at right shoulder. This could be bearish indication for today market.
4H Time Frame- Created Bearish Divergence on the Relative Strength Index indicator (RSI). Higher highs are being made in price but lower highs on indicator.
1H time Frame and down has a head and shoulders pattern. Currently sitting at right shoulder. This could be bearish indication for today market.

免责声明
这些信息和出版物并非旨在提供,也不构成TradingView提供或认可的任何形式的财务、投资、交易或其他类型的建议或推荐。请阅读使用条款了解更多信息。
免责声明
这些信息和出版物并非旨在提供,也不构成TradingView提供或认可的任何形式的财务、投资、交易或其他类型的建议或推荐。请阅读使用条款了解更多信息。