
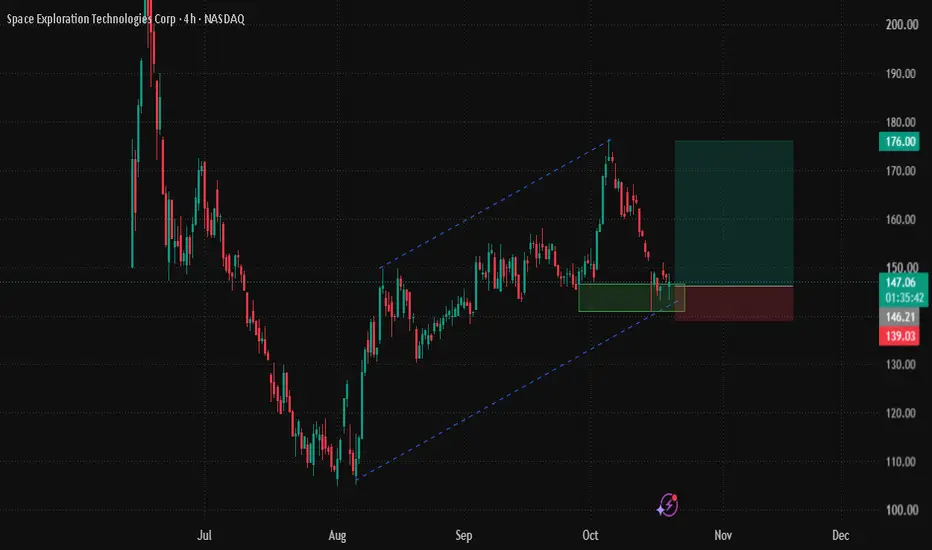
SPCX (Space Exploration Technologies Corp) is a long setup on the 4H chart. Price is retesting the lower line of an ascending channel after a rejection at the channel top near 176.50.
The proposed trade is entry 147.21, stop 139.00, and targets at 158, 168 and 176, which gives a reward-to-risk of 1:2.5 at TP2. The main catalyst is also the main risk: SpaceX reports Q3 earnings on Tuesday, October 20, after the close.
━━━━━━━━━━━━━━━━━━━━
FUNDAMENTAL OUTLOOK: WHY THE BIAS IS BULLISH (WITH CAUTION)
→ Market momentum and relative strength
• On your chart, price peaked near 225 after the June IPO and bottomed near 105 in early August. By late July the shares were about 50% below their post-IPO peak. From there the stock built a higher-low channel up to 176.50.
• The last two weeks were weak shows a fall of about 10% versus the previous week, from roughly 176.50 to 146.
• Part of the drop was a sympathy sell-off in AI and memory stocks. SpaceX fell with them after Chinese chipmaker CXMT announced progress on a new memory architecture. The stock is also levered to the AI trade and data-center build-out.
• The business itself is growing quickly. Q2 revenue was $7.8 billion, up 92% year on year, and the net loss of $541 million was far smaller than the $2.12 billion analysts expected. Starlink subscribers doubled to 12 million.
• Management reiterated a target of a $100 billion annualized revenue run rate by year-end.
→ Economic and fundamental catalysts
• Q3 earnings: Benzinga's consensus is about $12.76B revenue and $0.13 EPS. Visible Alpha's consensus was higher, at about $13B revenue and $0.18 EPS. Options imply a move of about 7.8%. The first report was a mixed reaction: a revenue beat, but the stock fell more than 8% after hours. The cost of AI spending was the concern.
• Analyst view: RBC reiterated Outperform with a $225 price target.
• Fed policy: The Fed's September hike was its first since July 2023, taking rates to 3.75%–4.00%. The next decision is October 28.
• Inflation: September CPI was 3.7% year on year, against a forecast of 3.6%. The Nasdaq had its biggest daily drop since July, with AI stocks sensitive to borrowing costs hit hardest. After the print, markets priced a 45% chance of an October hike, up from 20%. That figure is from October 14, so check where it stands now. WTI crude was above $95, which adds to the inflation pressure.
• Dollar: The dollar index was around 102 on October 9, near April 2025 highs. A stronger dollar is a headwind for growth stocks.
→ Market sentiment and seasonality
• Retail sentiment is neutral. Stocktwits sentiment moved to neutral from bearish, with message volume up 184%. Options positioning has leaned bearish: one options analytics firm said the market was "leaning short" the stock. That quote was from before the August report.
• Other risks are S&P's flag on AI debt risks and the 911.5 million shares that became eligible for sale after the lockup ended in August.
• Seasonality: I can't give you a real seasonal pattern. The stock listed in June 2026, so there is no multi-year history, and I won't invent one.
Net bias: bullish technically and in the business trend, but macro (hotter inflation, hike risk) and the AI-capex worry cut against it. That is why the plan below treats earnings as an event to manage.
━━━━━━━━━━━━━━━━━━━━
2) TECHNICAL ANALYSIS (4H)
→ Market structure
• Pattern: ascending channel. The swing points on the chart are:
o Post-IPO peak at about 225.5.
o Swing low at about 105 on August 3.
o Higher high at 176.5 on October 6, rejected at the channel top.
o Higher low at about 141.5 (the recent wick) on the lower channel line.
• The October pullback has held the lower channel line so far, so the structure is still intact.
→ Breakout and confirmation
• The early-October rally broke out of the September range (the 158 area) and ran to 176.5. The failure came afterward: price lost the 164 level, which is now resistance, and fell back to channel support.
• This is a retest of support, not a new breakout, so it has not confirmed yet. I'd want a 4H candle to close back above the 147–148 area with a rejection wick off the trendline. A close above 158 would confirm the move back into the upper channel.
• A 4H close below about 141 would turn this into a breakdown.
→ Key support and resistance
• Support: channel line and wick low at 141–147. The IPO price of 135 is the next major level, and my stop at 139 sits just above it.
• Resistance: 158 (September highs and mid-channel), 164 (the lost level), and 176 (channel top and October high).
━━━━━━━━━━━━━━━━━━━━
3) TRADE PLAN
Asset: SPCX (Space Exploration Technologies Corp, NASDAQ)
Direction: Bullish / Long
Timeframe: 4H
ENTRY: 147.21 (or scale in across 141–147)
STOP LOSS: 139.00 (−5.6%)
TAKE PROFIT: TP1 158.00 (+7.3%), TP2 168.00 (+14.1%), TP3 176.00 (+19.6%)
REWARD-TO-RISK RATIO: 1:1.3 / 1:2.5 / 1:3.5, headline 1:2.5 at TP2
━━━━━━━━━━━━━━━━━━━━
The earnings gap is the main risk to this plan. A 7.8% implied move from 147 is roughly 136 to 159, so a gap could jump straight past my 139 stop. If you want to avoid that, either wait for the post-earnings reaction before entering, or take a smaller position. I'm not a financial advisor, so size it to a loss you can accept.
The idea is invalid on a 4H close below 139, or below the channel line. Watch 135 (the IPO price) first, then roughly 125. The red dashed path on the chart shows this. A hot inflation surprise or a hike on October 28 could also push AI stocks, and SPCX, down.
交易开始
My entry just hit, The bullish setup is playing out as planned. Attention now shifts to TP2 at $168, with TP3 at $176 remaining the next upside target.
I’ve been trading gold and stocks on Bitget:bit.ly/3VOQCF4
免责声明
这些信息和出版物并非旨在提供,也不构成TradingView提供或认可的任何形式的财务、投资、交易或其他类型的建议或推荐。请阅读使用条款了解更多信息。
I’ve been trading gold and stocks on Bitget:bit.ly/3VOQCF4
免责声明
这些信息和出版物并非旨在提供,也不构成TradingView提供或认可的任何形式的财务、投资、交易或其他类型的建议或推荐。请阅读使用条款了解更多信息。