
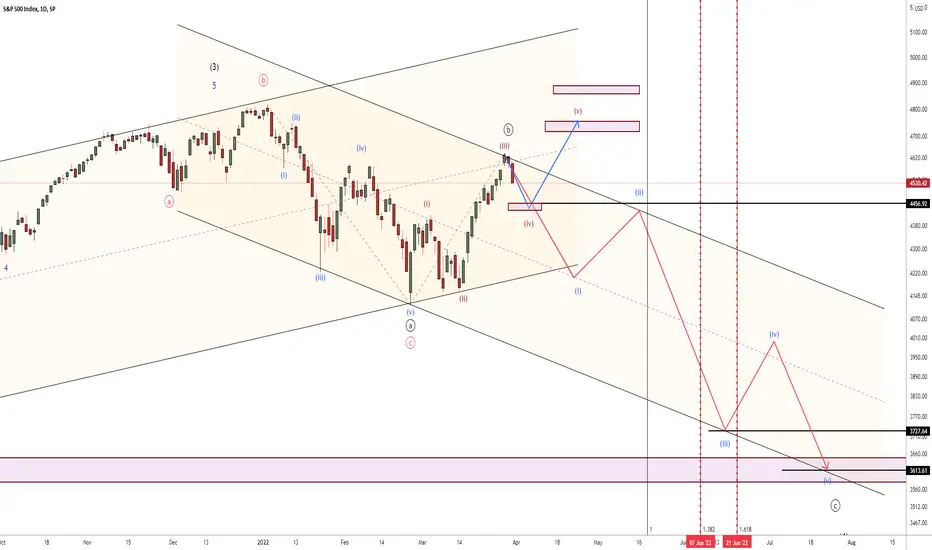
there are two scenarios in this chart.
1. if correction is over we follow Blueline
2. if we are in B wave then we follow Red line to 372 approx around mid-June
1. if correction is over we follow Blueline
2. if we are in B wave then we follow Red line to 372 approx around mid-June
交易结束:到达目标

免责声明
这些信息和出版物并非旨在提供,也不构成TradingView提供或认可的任何形式的财务、投资、交易或其他类型的建议或推荐。请阅读使用条款了解更多信息。
免责声明
这些信息和出版物并非旨在提供,也不构成TradingView提供或认可的任何形式的财务、投资、交易或其他类型的建议或推荐。请阅读使用条款了解更多信息。