
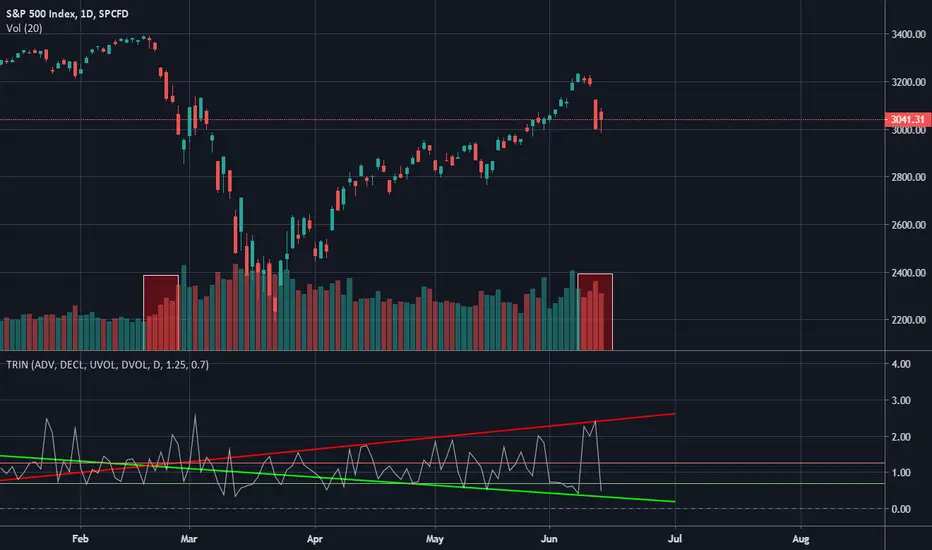
I touched on the TRIN already here...
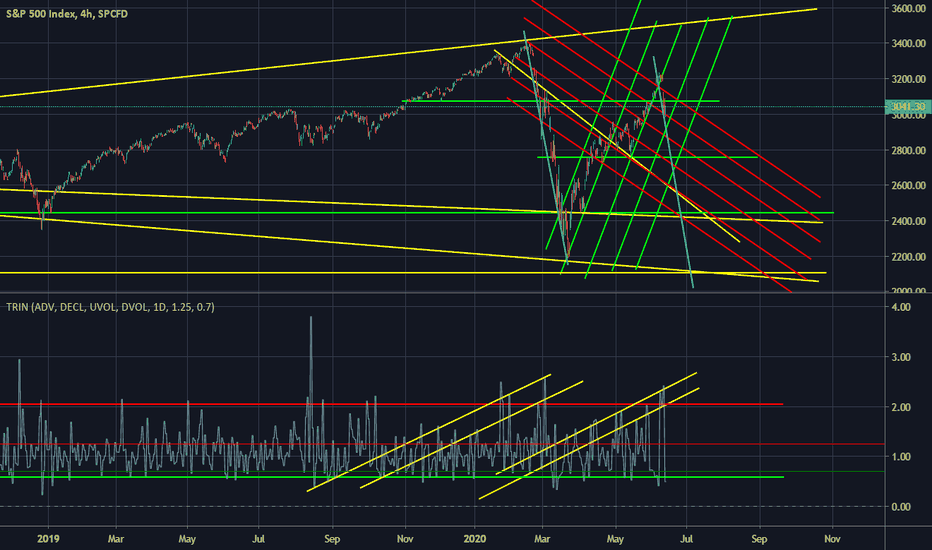
Wanted to take another angle.
Since the bounce, it has followed almost exactly to a megaphone pattern.
Those horizontal red and green lines are the indicator default, above red is SELL below green is BUY and in between in HOLD.
This is leaning very heavily into SELL and consistently holding PANIC SELL levels (>2).
We'll likely see another two red volume bars at least on Mon and Tues and see it flip back to panic sell before settling back under the red line around the green line while crashing down next few weeks.

Data analyst with a passion for best fit lines... B)
相关出版物
免责声明
这些信息和出版物并非旨在提供,也不构成TradingView提供或认可的任何形式的财务、投资、交易或其他类型的建议或推荐。请阅读使用条款了解更多信息。
Data analyst with a passion for best fit lines... B)
相关出版物
免责声明
这些信息和出版物并非旨在提供,也不构成TradingView提供或认可的任何形式的财务、投资、交易或其他类型的建议或推荐。请阅读使用条款了解更多信息。