
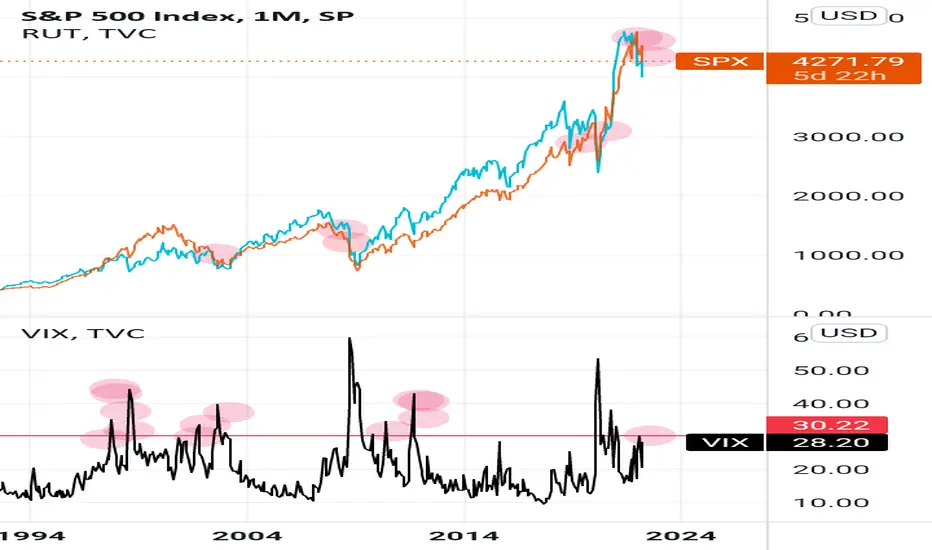
Chart 1: Whenever the the Russell 2000 came down and got close (from above) to the SPX, the SPX went further down.
(Pleased ignore the first red dot to the left, as the Russell die not come down there to meet the SPX but vice versa)
Chart 2: Whenever the VIX, coming from a modest down, crossed the red line, soon further spikes in volatility followed (red dots).
Particularly if the the VIX should cross the red line soon, you might consider hedging your positions.
注释
Please also note the VIX pattern since last May, which cannot be found at any other spot in the VIX!
免责声明
这些信息和出版物并非旨在提供,也不构成TradingView提供或认可的任何形式的财务、投资、交易或其他类型的建议或推荐。请阅读使用条款了解更多信息。