
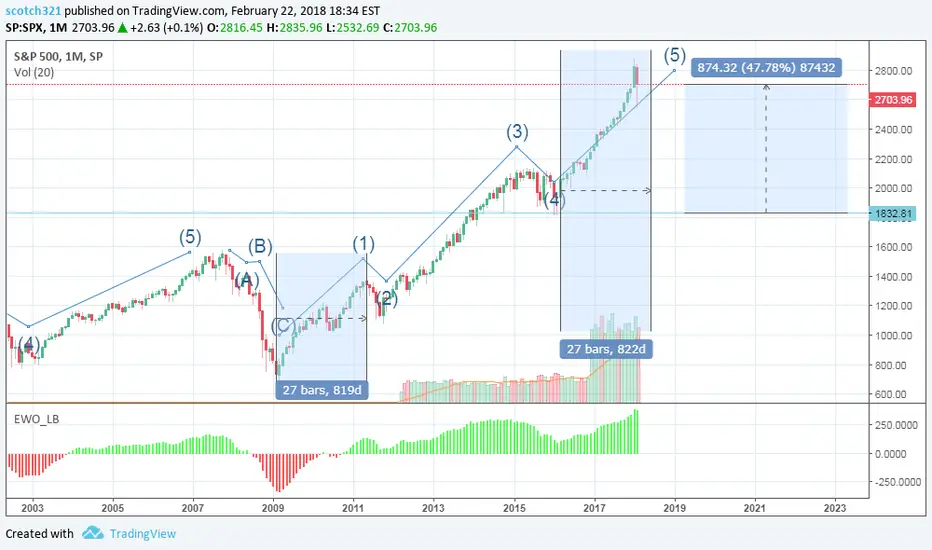
This analysis is strictly focused on Elliot wave theory and the current supercycle of the SAP500. From the way it appears on the charts, we are looking at the end of the 5th wave of the supercycle for the SAP500. By guidelines this could lead to a correction of between 40-50% over the course of the corrective wave pattern. As the chart attached shows we are looking at the end of the impulse waves in the next few months. With the arrival of the corrective waves we should see a price target near 1900USD. We will reach a market high in the second quarter of this year and then begin our descent.
Assumptions:
Wave three is the longest wave, therefore wave 1 length= wave 5 length
Elliot wave is a legitimate means of forecasting
Corrective waves will end near wave 4 low
the correction in February wasn't corrective wave A
I know anything
Assumptions:
Wave three is the longest wave, therefore wave 1 length= wave 5 length
Elliot wave is a legitimate means of forecasting
Corrective waves will end near wave 4 low
the correction in February wasn't corrective wave A
I know anything

免责声明
这些信息和出版物并非旨在提供,也不构成TradingView提供或认可的任何形式的财务、投资、交易或其他类型的建议或推荐。请阅读使用条款了解更多信息。