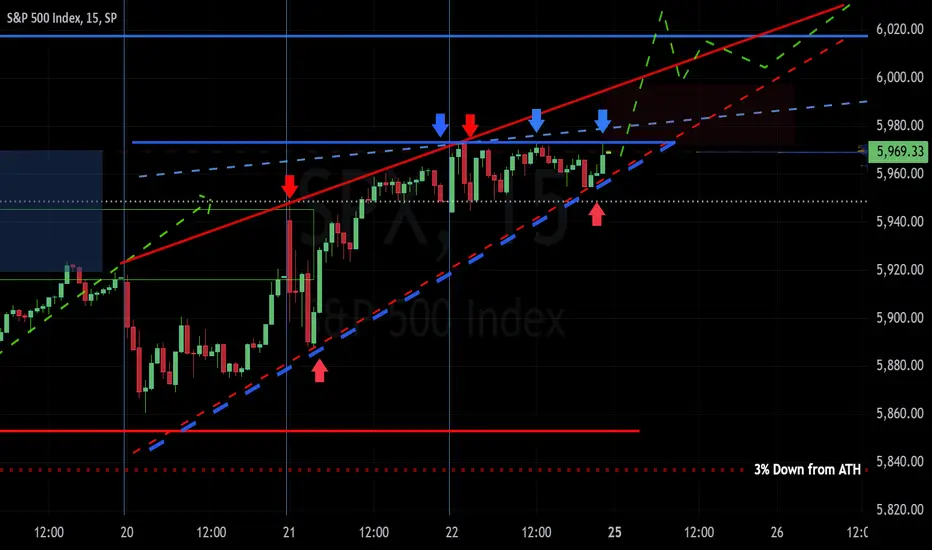
I've identified two potential patterns on the S&P 500  SPX chart:
Ascending Triangle (blue trendlines): Higher lows and flat highs, with breakout potential above the flat top or a breakdown below the higher lows. Indicated by blue arrows.
Rising Wedge Developing (red trend lines and arrows): Higher highs and higher lows, with a potential bearish breakout below the lower trend line or a less common bullish breakout above the upper trend line. Red arrows highlight the touch points on the rising wedge pattern.
Pattern Rules:
For a valid pattern, the following rules apply:
Ascending Triangle:
Rising Wedge:
Quick Review for Beginners:
New to chart patterns? Here's a quick rundown:
Keep in mind that chart patterns are not a guarantee of future price movements, but rather a tool to help identify potential trends and trading opportunities.
SPX chart:Ascending Triangle (blue trendlines): Higher lows and flat highs, with breakout potential above the flat top or a breakdown below the higher lows. Indicated by blue arrows.
Rising Wedge Developing (red trend lines and arrows): Higher highs and higher lows, with a potential bearish breakout below the lower trend line or a less common bullish breakout above the upper trend line. Red arrows highlight the touch points on the rising wedge pattern.
Pattern Rules:
For a valid pattern, the following rules apply:
Ascending Triangle:
- At least two higher lows
- Flat highs
- Decreasing volume
- Breakout above the flat top or breakdown below the higher lows
Rising Wedge:
- At least three touch points on each trend line (I will use as few as 2)
- Higher highs and higher lows
- Decreasing volume
- Breakout below the lower trend line or above the upper trend line (less common)
Quick Review for Beginners:
New to chart patterns? Here's a quick rundown:
- Higher lows: A series of lows that are higher than the previous ones.
- Flat highs: A series of highs that are roughly the same level.
- Decreasing volume: The trading volume decreases as the pattern forms.
- Breakout: When the price moves above or below the pattern's boundary.
- Trend lines: Lines drawn to connect the highs or lows of a pattern.
Keep in mind that chart patterns are not a guarantee of future price movements, but rather a tool to help identify potential trends and trading opportunities.

免责声明
这些信息和出版物并非旨在提供,也不构成TradingView提供或认可的任何形式的财务、投资、交易或其他类型的建议或推荐。请阅读使用条款了解更多信息。
免责声明
这些信息和出版物并非旨在提供,也不构成TradingView提供或认可的任何形式的财务、投资、交易或其他类型的建议或推荐。请阅读使用条款了解更多信息。