
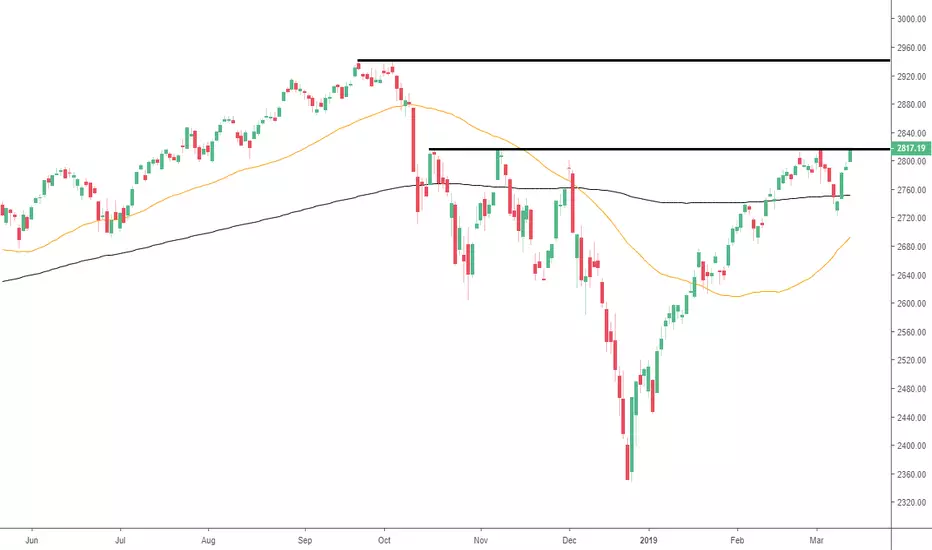
Last post: Nov 20th 2018. See chart.
Review: Price was heading down and moved below the weekly 50 simple moving average.
Update: The market has reversed since then and is now back above the 50 simple moving average and trying to break the current resistance level.
Conclusion: We need to see if price can break the resistance level and continue to move higher and eventually break the previous all-time high.
Any comments or questions, do not hesitate to leave them below. Give us the thumbs up if you share our sentiments!
Sublime Trading
Review: Price was heading down and moved below the weekly 50 simple moving average.
Update: The market has reversed since then and is now back above the 50 simple moving average and trying to break the current resistance level.
Conclusion: We need to see if price can break the resistance level and continue to move higher and eventually break the previous all-time high.
Any comments or questions, do not hesitate to leave them below. Give us the thumbs up if you share our sentiments!
Sublime Trading

Join Our Private Community
bit.ly/join-ST-community
Plus Get Our Ultimate Stock Market Blueprint.
bit.ly/join-ST-community
Plus Get Our Ultimate Stock Market Blueprint.
免责声明
这些信息和出版物并非旨在提供,也不构成TradingView提供或认可的任何形式的财务、投资、交易或其他类型的建议或推荐。请阅读使用条款了解更多信息。
Join Our Private Community
bit.ly/join-ST-community
Plus Get Our Ultimate Stock Market Blueprint.
bit.ly/join-ST-community
Plus Get Our Ultimate Stock Market Blueprint.
免责声明
这些信息和出版物并非旨在提供,也不构成TradingView提供或认可的任何形式的财务、投资、交易或其他类型的建议或推荐。请阅读使用条款了解更多信息。