
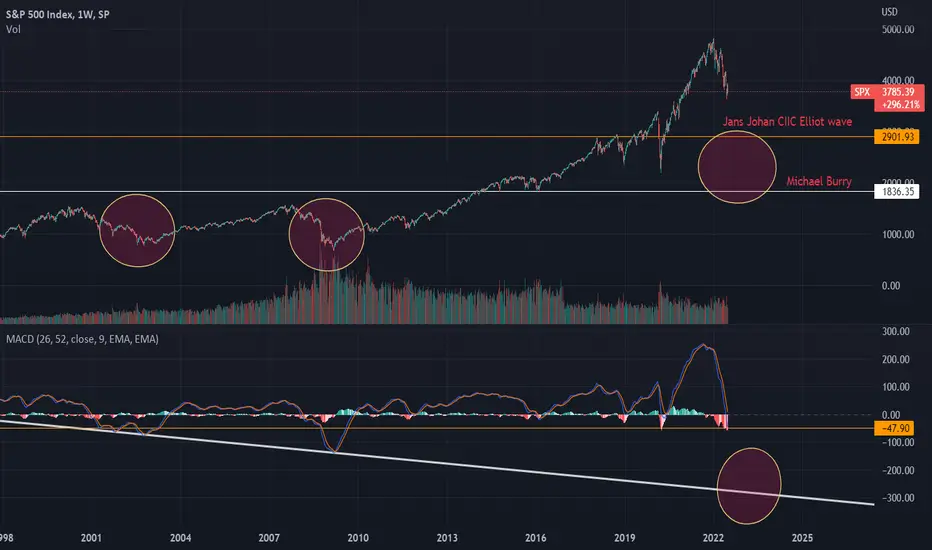
On a long-term weekly chart of the S&P 500, I have noticed that the MACD can give us an idea by its downtrend (white line) of when we might hit the bottom of the bear market. Being long-term, this could be from 6 months to more than a year. Combined with our Elliot Waves and Michael Burry's prediction we have an interval for the S&P 500 to fall from its current value between (20% & 48%) that the market has yet to fall.
The good thing about this is that home prices could plummet from rising mortgage rates.
For those who trade long crypto, and/or S&P 500 maybe it would be better to come back later.
The good thing about this is that home prices could plummet from rising mortgage rates.
For those who trade long crypto, and/or S&P 500 maybe it would be better to come back later.

免责声明
这些信息和出版物并非旨在提供,也不构成TradingView提供或认可的任何形式的财务、投资、交易或其他类型的建议或推荐。请阅读使用条款了解更多信息。