
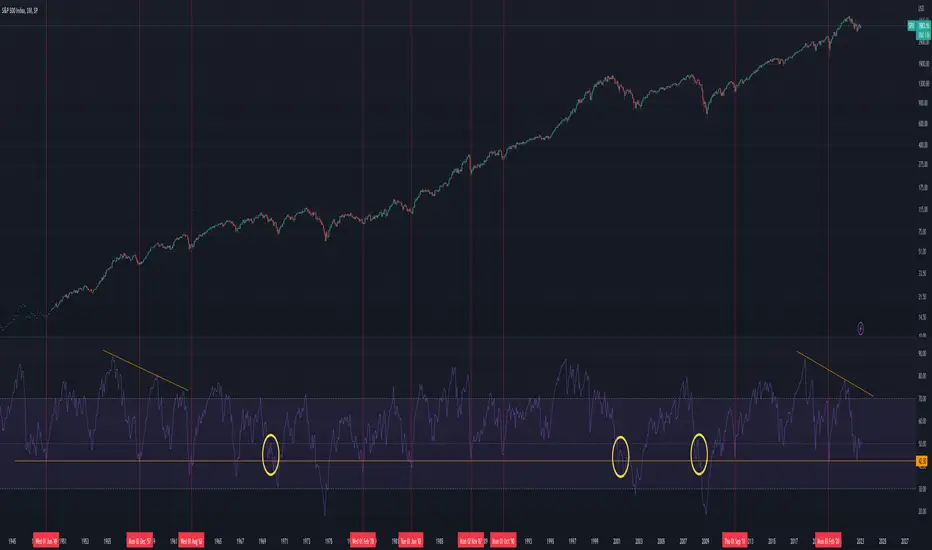
If we take a look a the RSI on a monthly for the SPX 500 over the last 70 years we can see a pattern emerge , the RSI level 42.30 seems to be a very important level where many rally's have started.
Over the last 70 years price has bounced off this level 10 times including the last bounce in 2022 , once price bounces off this level it signals a multi month rally.
1949
1957
1962
1978
1982
1987
1990
2011
2020
2022
There have been only three times where SPX has bounced off this level and failed to rally .
1969
2001
2008
Its amazing how in 70 years we only had 13 of these signals fire off . This could very well be a once in a life time opportunity to get into the market .
The SPX 500 has a much higher probability to rally than not based the historical data on this chart. It is possible that we going into a decade long contraction , similar to 1950-1960 where you can get all time highs and rally's but then followed with years sideways accumulation.
Over the last 70 years price has bounced off this level 10 times including the last bounce in 2022 , once price bounces off this level it signals a multi month rally.
1949
1957
1962
1978
1982
1987
1990
2011
2020
2022
There have been only three times where SPX has bounced off this level and failed to rally .
1969
2001
2008
Its amazing how in 70 years we only had 13 of these signals fire off . This could very well be a once in a life time opportunity to get into the market .
The SPX 500 has a much higher probability to rally than not based the historical data on this chart. It is possible that we going into a decade long contraction , similar to 1950-1960 where you can get all time highs and rally's but then followed with years sideways accumulation.

免责声明
这些信息和出版物并非旨在提供,也不构成TradingView提供或认可的任何形式的财务、投资、交易或其他类型的建议或推荐。请阅读使用条款了解更多信息。