
Technical Analysis and Outlook:
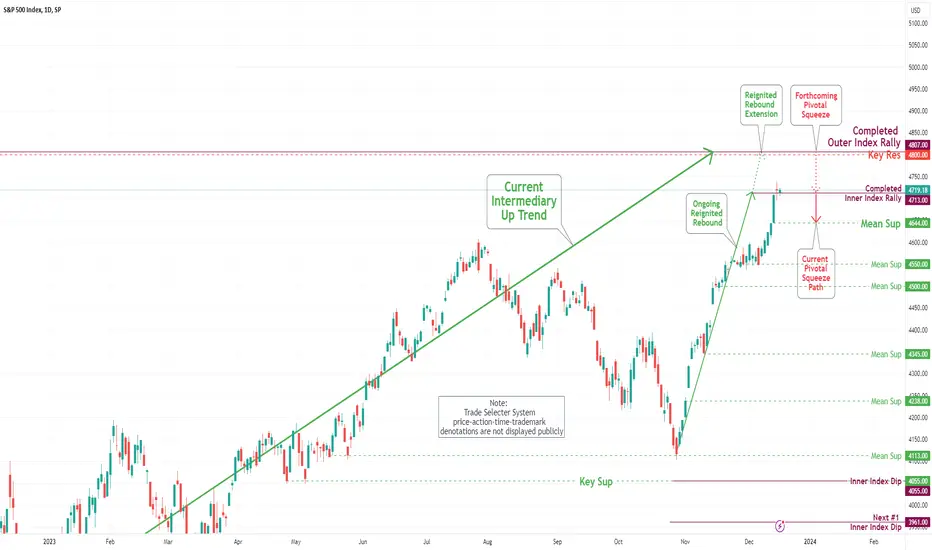
During this week's trading session, the S&P 500 index exhibited remarkable strength, with consistent price momentum throughout. The index managed to surpass our Key Resistance level of 4639 and Inner Index Rally level of 4647, finally resting at the completion of Inner Index Rally level of 4713.
Looking ahead, the following two targets for an upward trend are the completed Outer Index Rally level of 4807 and the Key Resistance of 4800. Both price levels were created on June 4th, 2022.
However, there are some concerns about a market squeeze from the current completed Inner Index Rally 4713 that might cause a transient pullback. In such a scenario, the index could move downward and reset itself to the Mean Support level of 4644. This level is considered a strong support level for the index and can provide an opportunity for traders and investors to make a suitable entry decision.
During this week's trading session, the S&P 500 index exhibited remarkable strength, with consistent price momentum throughout. The index managed to surpass our Key Resistance level of 4639 and Inner Index Rally level of 4647, finally resting at the completion of Inner Index Rally level of 4713.
Looking ahead, the following two targets for an upward trend are the completed Outer Index Rally level of 4807 and the Key Resistance of 4800. Both price levels were created on June 4th, 2022.
However, there are some concerns about a market squeeze from the current completed Inner Index Rally 4713 that might cause a transient pullback. In such a scenario, the index could move downward and reset itself to the Mean Support level of 4644. This level is considered a strong support level for the index and can provide an opportunity for traders and investors to make a suitable entry decision.

免责声明
这些信息和出版物并非旨在提供,也不构成TradingView提供或认可的任何形式的财务、投资、交易或其他类型的建议或推荐。请阅读使用条款了解更多信息。