
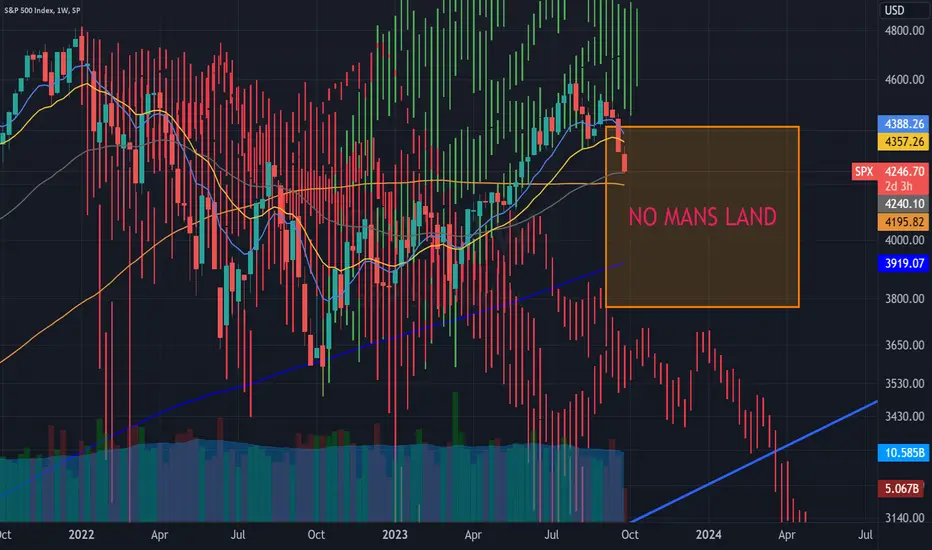
This is a weekly chart and I meant to share this on Friday; but forgot. Blue vertical lines are the paths from previous bear market lows to new all time highs, over-layed to the bottom of October 2022. Red vertical lines are the bear market paths from all time highs to bear market lows, over-layed to the high of January 2022.
As you can see we are no longer following the path of the "new" bull markets, and we we deviated away from bear market paths... well a while ago. So should we have been on a bear market path this whole time, but the stimulus from Inflation Reduction Act and Chips Act helped support the market for just a short period of time?!?!? Well we will find out. I just know this is truly a historic pattern.
As you can see we are no longer following the path of the "new" bull markets, and we we deviated away from bear market paths... well a while ago. So should we have been on a bear market path this whole time, but the stimulus from Inflation Reduction Act and Chips Act helped support the market for just a short period of time?!?!? Well we will find out. I just know this is truly a historic pattern.

免责声明
这些信息和出版物并非旨在提供,也不构成TradingView提供或认可的任何形式的财务、投资、交易或其他类型的建议或推荐。请阅读使用条款了解更多信息。
免责声明
这些信息和出版物并非旨在提供,也不构成TradingView提供或认可的任何形式的财务、投资、交易或其他类型的建议或推荐。请阅读使用条款了解更多信息。