
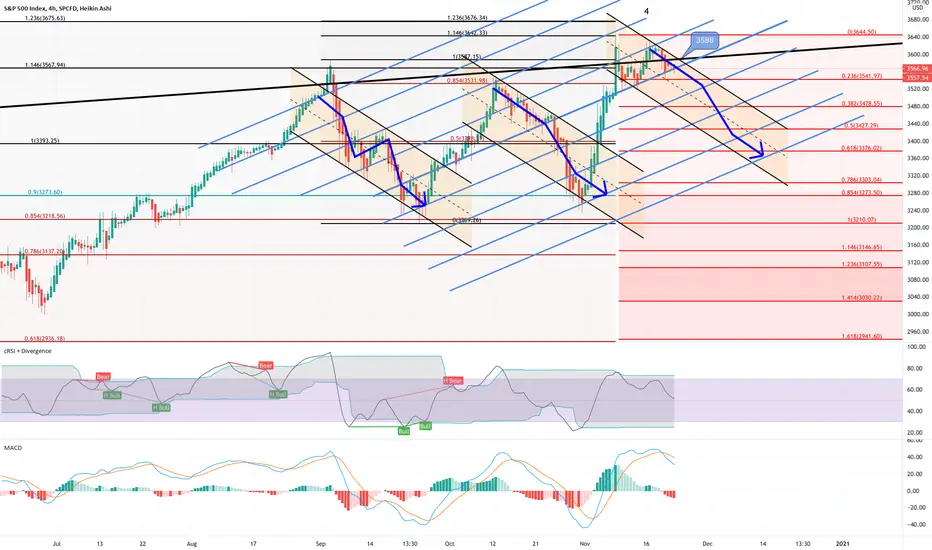
Here is what I see for down channels in the S&P. If this pattern holds, then we should see around 3588 today and then the correction continue. If S&P can break out above that level and hold above it all week, then we could be pushing up to the 1.2 fib ext (3676). However, the RSI and the MACD don't seem to be showing this as a high probability.
注释
注释
注释
That was a quick reversal. Maybe it was a close the morning gap and will bounce back, otherwise that is pretty weak to only hold it for 5-10 minutes.注释
I totally missed this regression channel. Note how it was rejected back down. This is a clear sign that this market is heading down now.注释
Touching top edge of both channels. This is prime location for a reversal.注释
End of day. Went pretty close to my idea.注释
Big breakout this morning. Looking like it may run for 3628.
相关出版物
免责声明
这些信息和出版物并非旨在提供,也不构成TradingView提供或认可的任何形式的财务、投资、交易或其他类型的建议或推荐。请阅读使用条款了解更多信息。