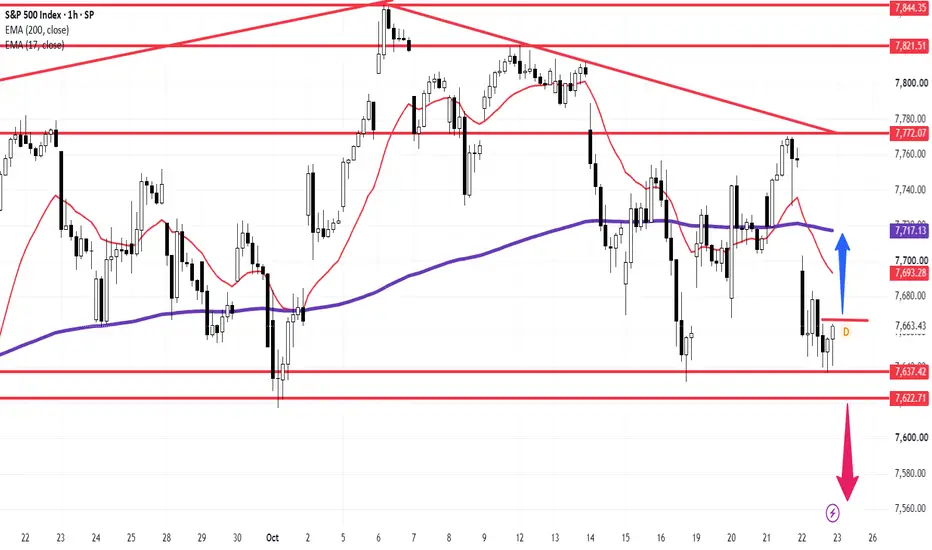
S&P 500 ( SPX) 1h Technical Matrix: Friday Rebound Outlook off 7,663 Support Base Targets 17-EMA (7,693) & 200-EMA (7,717)
### 🇺🇸 S&P 500 ($SPCFD / SPX) 1-Hour Technical Matrix (Ref: SPX_2026-10-23_12-01-00.png)
We are issuing an updated 1-Hour (1h) technical matrix for the S&P 500 Index ($SPCFD) heading into Friday's session. Following a corrective drop that found solid demand absorption around the lower horizontal baseline at 7,637.42, price action is setting up a short-term mean-reversion recovery wave.
The index is currently trading at **7,663.43 (+0.09%)**, holding right along its key static horizontal floor and preparing an intraday rebound effort.
---
### 🔍 Technical Architecture & Level Roadmap:
1. **Immediate Demand Base & Decision Floor:**
* **Static Horizontal Pivot:** **7,663.43** (red horizontal line) — Active support node providing a springboard for the Friday recovery wave.
* **Secondary Structural Floor:** **7,637.42 – 7,622.71** (red horizontal lines) — Key demand zone that must hold to preserve the rebound thesis.
2. **Upside Recovery Pathway (Blue Arrow Scenario):**
* **Immediate Dynamic Resistance (17-EMA):** **7,693.28** (red line) — First intraday obstacle required to confirm momentum expansion.
* **Institutional Dynamic Target (200-EMA):** **7,717.13** (purple line) — Core dynamic objective for the mean-reversion bounce.
* **Upper Structural Ceiling:** **7,772.07** (red horizontal line).
3. **Bearish Continuation Pathway (Red Arrow Scenario):**
* **Breakdown Triggers:** **7,637.42 / 7,622.71** — A loss of these consecutive static floors invalidates the recovery setup, accelerating short momentum toward lower extension targets near **7,560.00**.
---
### 🛡️ Strategic Operational Scenarios:
* **Scenario A — Bullish Mean-Reversion Rebound (Primary Expectation - Blue Arrow):** Holding above **7,663.43** followed by a hourly candle close above the **17-EMA (7,693.28)** confirms buyer absorption, opening a recovery vector toward the **7,717.13 (200-EMA)** institutional demand zone.
* **Scenario B — Bearish Breakdown Extension (Red Arrow):** A decisive hourly close below **7,622.71** breaks the macro support floor, unlocking a downside expansion wave toward **7,560.00**.
### 📊 Tactical Parameters Summary:
* **Current Bias:** Neutral / Intraday Recovery Rebound Setup
* **Execution Price:** 7,663.43
* **Immediate Dynamic Resistance (17-EMA):** 7,693.28
* **Institutional Dynamic Target (200-EMA):** 7,717.13
* **Critical Support Base:** 7,637.42 / 7,622.71
* **Macro Downside Extension:** 7,560.00
---
📊 **ChartPro Data**
*US Equity Index Architecture, Multi-Timeframe Dynamic Averages & Systematic Risk Control.*
⚠️ **Disclaimer:** Educational study only. Not financial advice. Maintain disciplined position sizing and strict risk management protocols.
SPX) 1h Technical Matrix: Friday Rebound Outlook off 7,663 Support Base Targets 17-EMA (7,693) & 200-EMA (7,717)### 🇺🇸 S&P 500 ($SPCFD / SPX) 1-Hour Technical Matrix (Ref: SPX_2026-10-23_12-01-00.png)
We are issuing an updated 1-Hour (1h) technical matrix for the S&P 500 Index ($SPCFD) heading into Friday's session. Following a corrective drop that found solid demand absorption around the lower horizontal baseline at 7,637.42, price action is setting up a short-term mean-reversion recovery wave.
The index is currently trading at **7,663.43 (+0.09%)**, holding right along its key static horizontal floor and preparing an intraday rebound effort.
---
### 🔍 Technical Architecture & Level Roadmap:
1. **Immediate Demand Base & Decision Floor:**
* **Static Horizontal Pivot:** **7,663.43** (red horizontal line) — Active support node providing a springboard for the Friday recovery wave.
* **Secondary Structural Floor:** **7,637.42 – 7,622.71** (red horizontal lines) — Key demand zone that must hold to preserve the rebound thesis.
2. **Upside Recovery Pathway (Blue Arrow Scenario):**
* **Immediate Dynamic Resistance (17-EMA):** **7,693.28** (red line) — First intraday obstacle required to confirm momentum expansion.
* **Institutional Dynamic Target (200-EMA):** **7,717.13** (purple line) — Core dynamic objective for the mean-reversion bounce.
* **Upper Structural Ceiling:** **7,772.07** (red horizontal line).
3. **Bearish Continuation Pathway (Red Arrow Scenario):**
* **Breakdown Triggers:** **7,637.42 / 7,622.71** — A loss of these consecutive static floors invalidates the recovery setup, accelerating short momentum toward lower extension targets near **7,560.00**.
---
### 🛡️ Strategic Operational Scenarios:
* **Scenario A — Bullish Mean-Reversion Rebound (Primary Expectation - Blue Arrow):** Holding above **7,663.43** followed by a hourly candle close above the **17-EMA (7,693.28)** confirms buyer absorption, opening a recovery vector toward the **7,717.13 (200-EMA)** institutional demand zone.
* **Scenario B — Bearish Breakdown Extension (Red Arrow):** A decisive hourly close below **7,622.71** breaks the macro support floor, unlocking a downside expansion wave toward **7,560.00**.
### 📊 Tactical Parameters Summary:
* **Current Bias:** Neutral / Intraday Recovery Rebound Setup
* **Execution Price:** 7,663.43
* **Immediate Dynamic Resistance (17-EMA):** 7,693.28
* **Institutional Dynamic Target (200-EMA):** 7,717.13
* **Critical Support Base:** 7,637.42 / 7,622.71
* **Macro Downside Extension:** 7,560.00
---
📊 **ChartPro Data**
*US Equity Index Architecture, Multi-Timeframe Dynamic Averages & Systematic Risk Control.*
⚠️ **Disclaimer:** Educational study only. Not financial advice. Maintain disciplined position sizing and strict risk management protocols.

免责声明
这些信息和出版物并非旨在提供,也不构成TradingView提供或认可的任何形式的财务、投资、交易或其他类型的建议或推荐。请阅读使用条款了解更多信息。
免责声明
这些信息和出版物并非旨在提供,也不构成TradingView提供或认可的任何形式的财务、投资、交易或其他类型的建议或推荐。请阅读使用条款了解更多信息。