
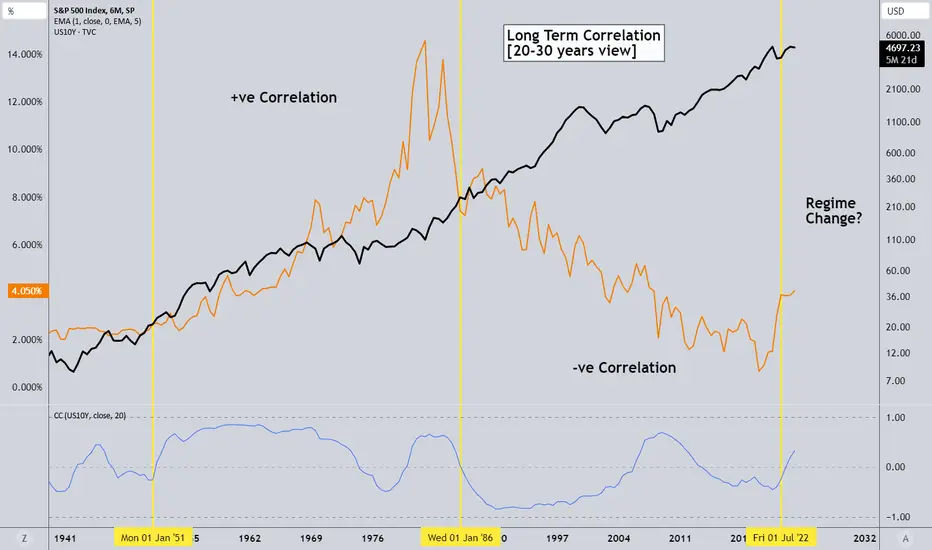
This is comparing between the super trend of the S&P 500 (Cash) index and the US 10 year bond yields.
Previously, for a good 35 years, bond yields and equities shared a strong positive correlation. (1951 to 1986)
Then correlation swung the other way and for the next 37 years, we started seeing negative correlation. Falling yields with equities continuing the advancement.
Question is.. What happens now for the next 30-35 years?
Previously, for a good 35 years, bond yields and equities shared a strong positive correlation. (1951 to 1986)
Then correlation swung the other way and for the next 37 years, we started seeing negative correlation. Falling yields with equities continuing the advancement.
Question is.. What happens now for the next 30-35 years?

Suppose one of you wants to build a tower. Won’t you first sit down and estimate the cost to see if you have enough money to complete it? - Luke 14:28
免责声明
这些信息和出版物并非旨在提供,也不构成TradingView提供或认可的任何形式的财务、投资、交易或其他类型的建议或推荐。请阅读使用条款了解更多信息。
Suppose one of you wants to build a tower. Won’t you first sit down and estimate the cost to see if you have enough money to complete it? - Luke 14:28
免责声明
这些信息和出版物并非旨在提供,也不构成TradingView提供或认可的任何形式的财务、投资、交易或其他类型的建议或推荐。请阅读使用条款了解更多信息。