
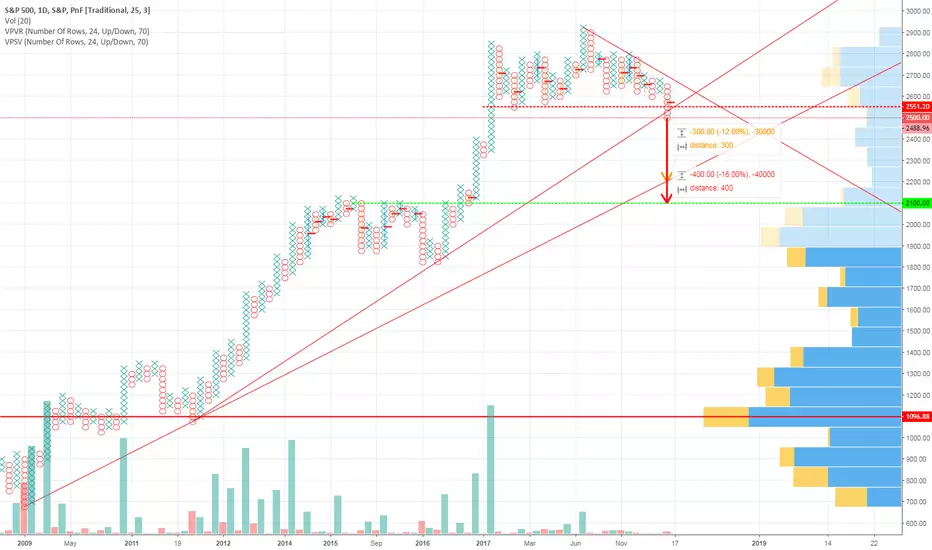
This is a corrective/bearish outlook on S&P500 Index based on Point & Figure charting.
The Index managed to breach below the first uptrend line around the 2,550 level. Based on P&F charting (which is, arguably, one of the oldest charting techniques used in the western hemisphere), I expect the Index to dip to the second major uptrend line @ 2,200 points (-12% from 2,500 level) as a first target. My second expected target is around the peak of the first consolidation seen on the chart @ 2,100 points (-16% from 2,500). The third expected target, albeit far-fetched but remains a possibility, has been derived from the horizontal-counting and not shown on the chart, is 1,750 points (-30% from 2,500) points.
It should be noted that the P&F chart used has been setup as 25x3
*Always remember; this is an opinion, not a recommendation*

免责声明
这些信息和出版物并非旨在提供,也不构成TradingView提供或认可的任何形式的财务、投资、交易或其他类型的建议或推荐。请阅读使用条款了解更多信息。