
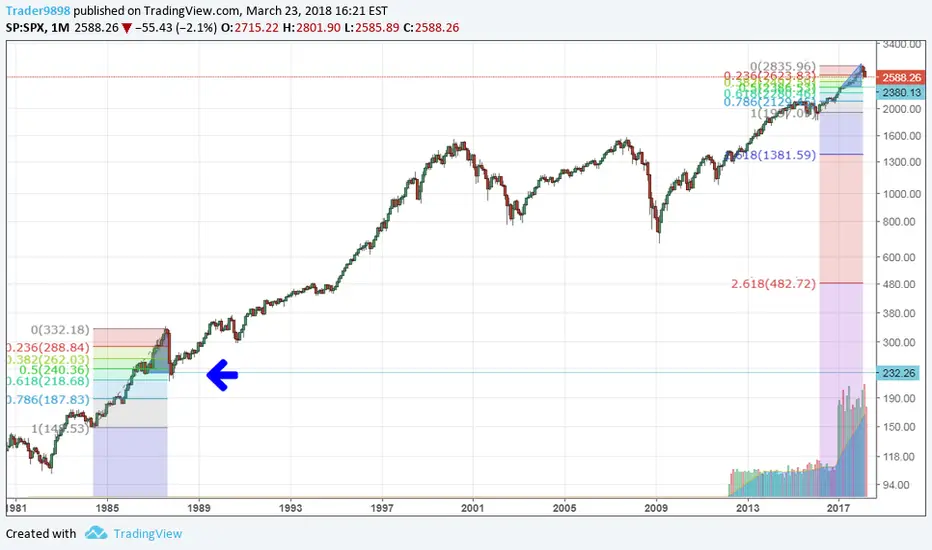
This is a re-post of a chart from one month ago after the dow dropped 700 points in one day. My extrapolation from that post compared this to 1987, in which there was a 2 year run up, and then a quick crash which erased 1 years worth of gains.
While this 2018 crash appears to be slower in time than 1987's two month crash period, the charts nonetheless look the same to me. If we extrapolate, then SPX's current price has only reached half way to where it will eventually bottom out, which should be around 2380.
While this 2018 crash appears to be slower in time than 1987's two month crash period, the charts nonetheless look the same to me. If we extrapolate, then SPX's current price has only reached half way to where it will eventually bottom out, which should be around 2380.

免责声明
这些信息和出版物并非旨在提供,也不构成TradingView提供或认可的任何形式的财务、投资、交易或其他类型的建议或推荐。请阅读使用条款了解更多信息。
免责声明
这些信息和出版物并非旨在提供,也不构成TradingView提供或认可的任何形式的财务、投资、交易或其他类型的建议或推荐。请阅读使用条款了解更多信息。