
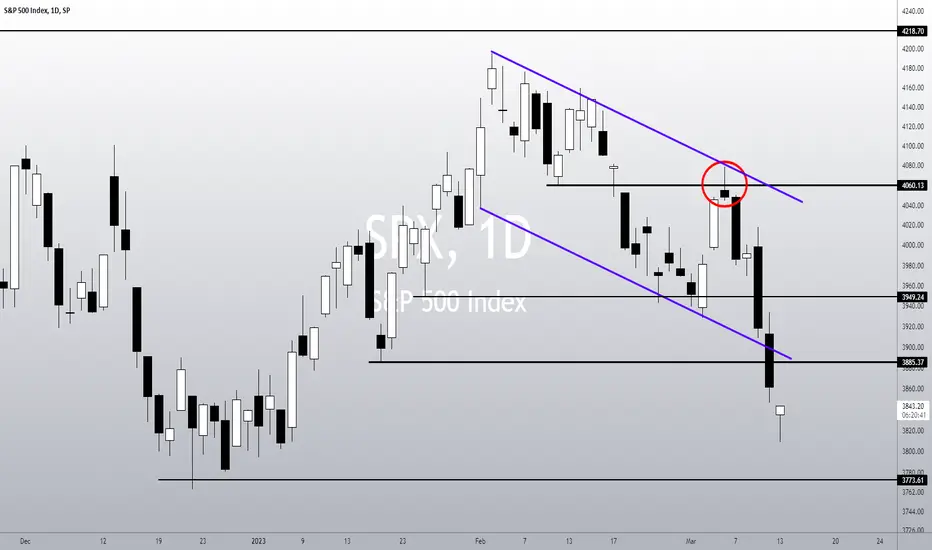
• The SPX lost two important support levels last week. First, the 3,885, a key point that worked as a support a few times this year. Second, the baseline of a Descending Channel;
• Meaning, the trend was already bearish, now the index is just crashing;
• There’s no meaningful bullish reaction indicating that a bottom is near;
• Even if the index reacts today, the problem is that the previous support levels, the 3,885 and the baseline of the Descending Channel, are now resistance levels, and any bearish sign under this resistance would mean an opportunity to sell. Now, let's take a look at the weekly chart:

• In theory, the SPX is looking for its next support, which is at 3,773, and that's the next technical target in the daily chart. Long-term speaking, if the index loses this support, it would trigger a kind of Double Top chart pattern in the weekly chart, indicating that it could seek the 3,500 next.
Remember to follow me to keep in touch with my daily analysis!
• Meaning, the trend was already bearish, now the index is just crashing;
• There’s no meaningful bullish reaction indicating that a bottom is near;
• Even if the index reacts today, the problem is that the previous support levels, the 3,885 and the baseline of the Descending Channel, are now resistance levels, and any bearish sign under this resistance would mean an opportunity to sell. Now, let's take a look at the weekly chart:
• In theory, the SPX is looking for its next support, which is at 3,773, and that's the next technical target in the daily chart. Long-term speaking, if the index loses this support, it would trigger a kind of Double Top chart pattern in the weekly chart, indicating that it could seek the 3,500 next.
Remember to follow me to keep in touch with my daily analysis!

免责声明
这些信息和出版物并非旨在提供,也不构成TradingView提供或认可的任何形式的财务、投资、交易或其他类型的建议或推荐。请阅读使用条款了解更多信息。