
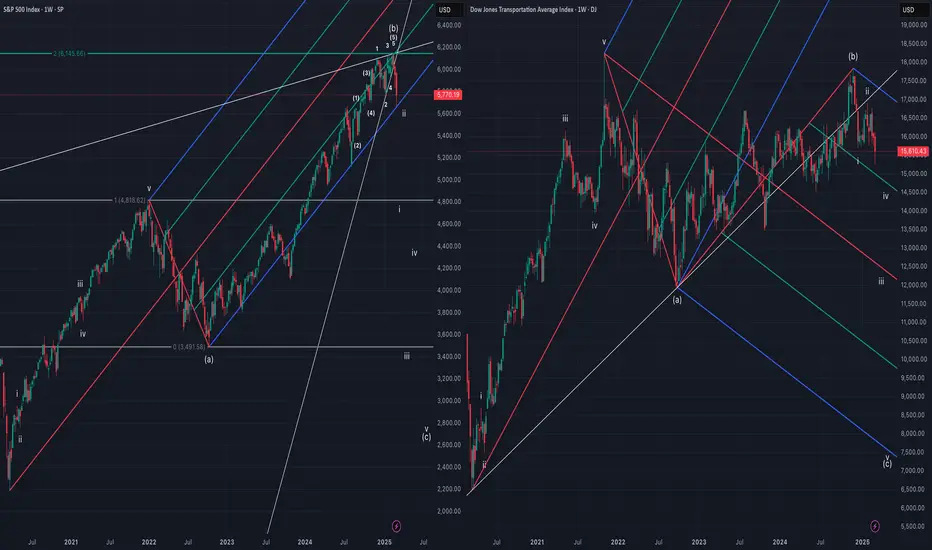
Chart comparing SPX and DJT.
SPX drawn with expanded flat, (b) is 200% of (a) and completes with ending diagonal wedge.
DJT drawn with regular flat, (b) ~90% of (a), wave (c) began in November of 2024 and currently in wave iii of (c).
Bears looking for SPX pitchfork support to break and become resistance, both SPX and DJT looking to eventually break October 2022 low and approach March 2020 lows to complete their corrective structures.

免责声明
这些信息和出版物并非旨在提供,也不构成TradingView提供或认可的任何形式的财务、投资、交易或其他类型的建议或推荐。请阅读使用条款了解更多信息。
免责声明
这些信息和出版物并非旨在提供,也不构成TradingView提供或认可的任何形式的财务、投资、交易或其他类型的建议或推荐。请阅读使用条款了解更多信息。