
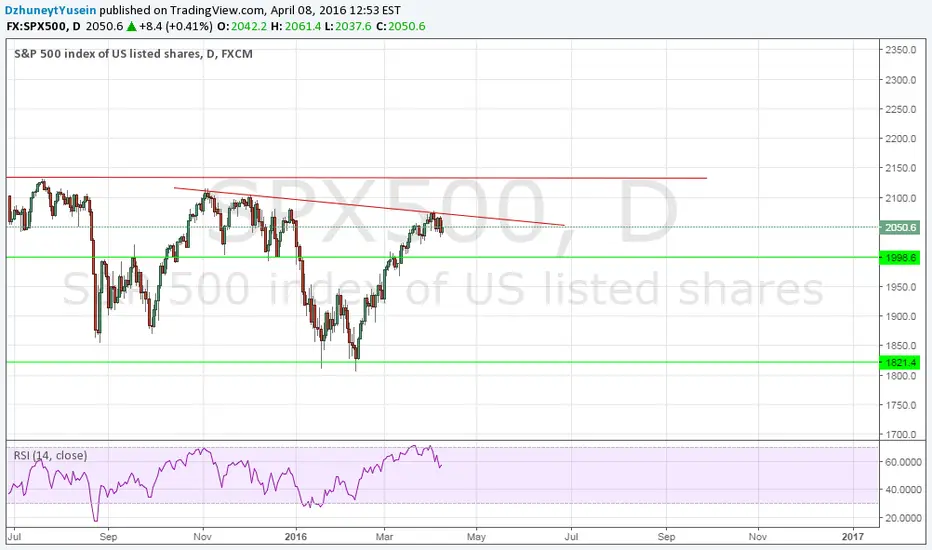
Many prominent economists think that SPX500 will fall down to around 1800 and will go back to 2000 at the end of the year.
The resistance line that has been in place middle of last year was retested again at the beginning of April, unsuccessfully. 1HR Fibonacci shows downward trend, SPX500 hit 0.7 level and started falling. RSI for almost all time frames is above 50%.
Test of structure at 1998.6 and if it breaks it (highly likely) it should fall down to 1821.4, another structure.
Also, there is a 'head and shoulders' pattern in 1HR chart with right shoulder indicating crash.
The resistance line that has been in place middle of last year was retested again at the beginning of April, unsuccessfully. 1HR Fibonacci shows downward trend, SPX500 hit 0.7 level and started falling. RSI for almost all time frames is above 50%.
Test of structure at 1998.6 and if it breaks it (highly likely) it should fall down to 1821.4, another structure.
Also, there is a 'head and shoulders' pattern in 1HR chart with right shoulder indicating crash.

免责声明
这些信息和出版物并非旨在提供,也不构成TradingView提供或认可的任何形式的财务、投资、交易或其他类型的建议或推荐。请阅读使用条款了解更多信息。
免责声明
这些信息和出版物并非旨在提供,也不构成TradingView提供或认可的任何形式的财务、投资、交易或其他类型的建议或推荐。请阅读使用条款了解更多信息。