
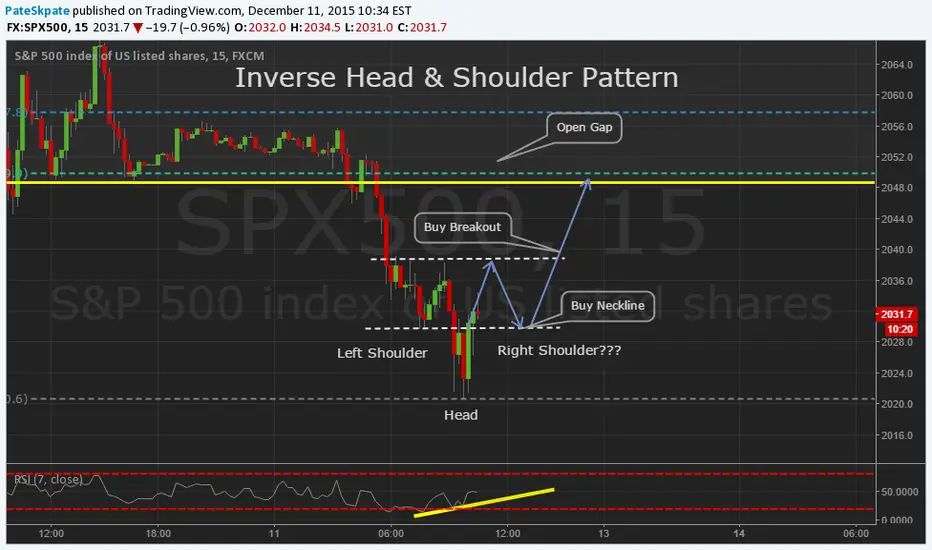
This is easier seen on the 5min chart. The S&P 500 has put in an Inverse Head & Shoulders Pattern. This is a reversal pattern. Look to buy the Neckline or the Breakout (shown on chart). Look for Targets around Gap fill.
订单已取消

免责声明
这些信息和出版物并非旨在提供,也不构成TradingView提供或认可的任何形式的财务、投资、交易或其他类型的建议或推荐。请阅读使用条款了解更多信息。
免责声明
这些信息和出版物并非旨在提供,也不构成TradingView提供或认可的任何形式的财务、投资、交易或其他类型的建议或推荐。请阅读使用条款了解更多信息。