
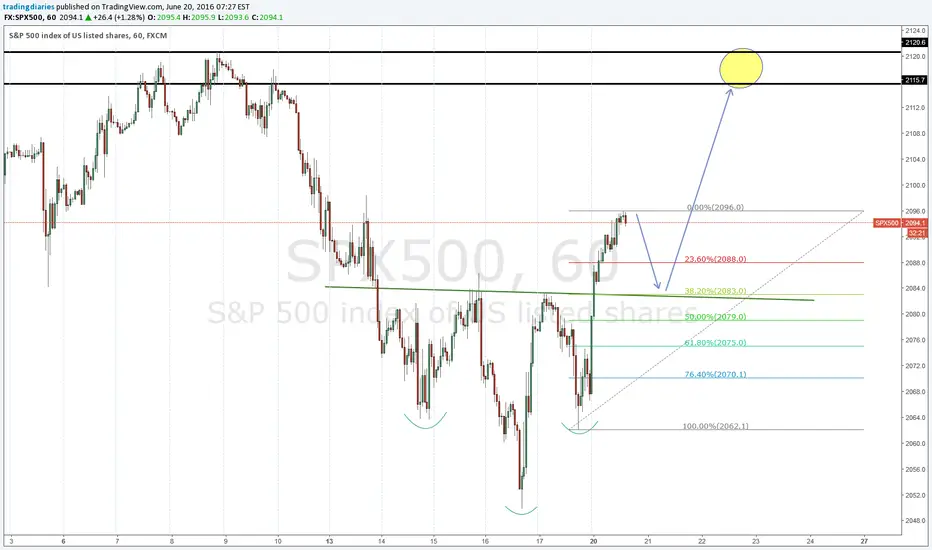
The S&P500 shows a nice reversal head and shoulders formation on the chart.
The S&P is moving in an uptrend for the last days and weeks. I think this formation shows good that the trend will continue after a pullback.
The neckline of this formation is also at the 38.2 fib level of the last upside move. So I expect a short term price fall back to 2083 +/-. And then the price should go up to an area around 2115-2120.
The S&P is moving in an uptrend for the last days and weeks. I think this formation shows good that the trend will continue after a pullback.
The neckline of this formation is also at the 38.2 fib level of the last upside move. So I expect a short term price fall back to 2083 +/-. And then the price should go up to an area around 2115-2120.
注释
Right now the price is back at the neckline, I will watch the chart now for a good opportunity to move in and open a long trade. I will update the chart again if that is the case and I found a good entry.交易开始
The price is back at the neckline.I will open a trade now with a tight stop loss below the last low under the neckline.
Target is around 2110-2120. Will see how it works.
Just to mention it, this is no edvice to anyone to do as I do. Do your own analysis and decide if you want to take a trade or not. This is just my opinion.
交易手动结束
I closed my trade today after the price bounced back. So I closed at 2091 my trade and took a profit home. Now I will stay out of the market until the referendum for the "Brexit" is over.
免责声明
这些信息和出版物并非旨在提供,也不构成TradingView提供或认可的任何形式的财务、投资、交易或其他类型的建议或推荐。请阅读使用条款了解更多信息。
免责声明
这些信息和出版物并非旨在提供,也不构成TradingView提供或认可的任何形式的财务、投资、交易或其他类型的建议或推荐。请阅读使用条款了解更多信息。