
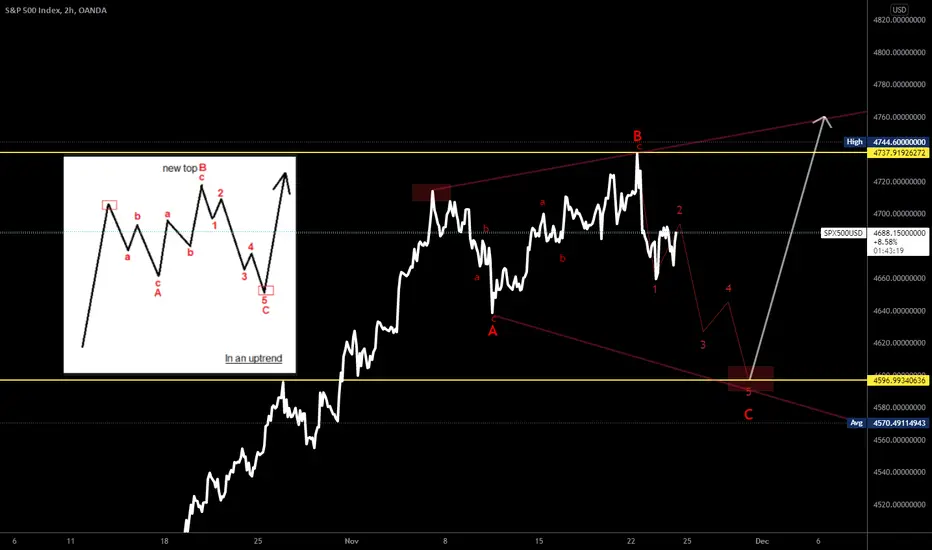
Noticed this same pattern on Bitcoin (daily / 4H timeframes), and then saw that it was also potentially occurring here with S&P 500, but on lower timeframes (2H or lower).
Expecting a move down to our last two levels of support and then a move back up, drawn roughly on the chart.
Expecting a move down to our last two levels of support and then a move back up, drawn roughly on the chart.

免责声明
这些信息和出版物并非旨在提供,也不构成TradingView提供或认可的任何形式的财务、投资、交易或其他类型的建议或推荐。请阅读使用条款了解更多信息。
免责声明
这些信息和出版物并非旨在提供,也不构成TradingView提供或认可的任何形式的财务、投资、交易或其他类型的建议或推荐。请阅读使用条款了解更多信息。