
Hello everyone,
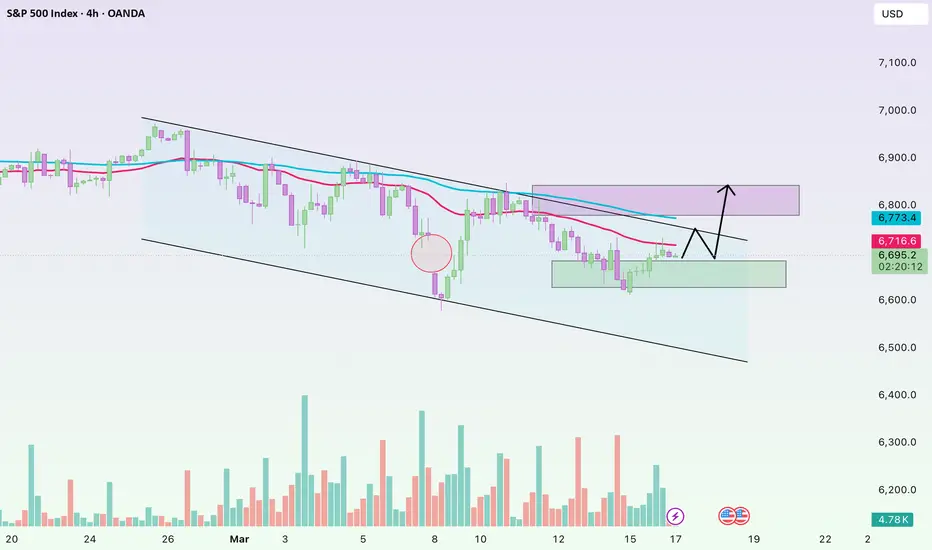
Looking at the S&P 500 chart on the H4 timeframe, the index still appears to be moving within a corrective structure following the strong rally seen earlier. The index is currently trading around 6,696 points and remains below two key moving averages, suggesting that short-term momentum is still under bearish pressure, even though technical rebounds have begun to appear.
In recent sessions, the S&P 500 has continued to form a sequence of lower highs, reflecting cautious investor sentiment as the index has yet to reclaim the moving-average zone. The shorter-term moving average remains below the longer-term average and continues to slope downward, indicating that the corrective momentum has not fully faded.
However, after testing the 6,650 area, buying interest began to re-emerge, allowing the index to recover modestly in the latest sessions. This zone is now acting as a short-term support area where capital has started to return following the sharp decline earlier this month.
Based on the current structure, my base scenario is that the index could extend its rebound toward the 6,730–6,750 region. This area represents the nearest resistance zone, as it aligns with the cluster of moving averages on the H4 chart. If buying pressure proves insufficient to break above this level, the market may continue to trade within a consolidation phase before establishing a clearer directional trend.
From a macro perspective, the U.S. equity market is still closely monitoring signals from the Federal Reserve regarding the future interest-rate path. Expectations that the Fed may maintain a cautious monetary stance for some time are making capital flows within equities more selective, particularly after the strong rally seen in major indices earlier in the year.
Looking at the S&P 500 chart on the H4 timeframe, the index still appears to be moving within a corrective structure following the strong rally seen earlier. The index is currently trading around 6,696 points and remains below two key moving averages, suggesting that short-term momentum is still under bearish pressure, even though technical rebounds have begun to appear.
In recent sessions, the S&P 500 has continued to form a sequence of lower highs, reflecting cautious investor sentiment as the index has yet to reclaim the moving-average zone. The shorter-term moving average remains below the longer-term average and continues to slope downward, indicating that the corrective momentum has not fully faded.
However, after testing the 6,650 area, buying interest began to re-emerge, allowing the index to recover modestly in the latest sessions. This zone is now acting as a short-term support area where capital has started to return following the sharp decline earlier this month.
Based on the current structure, my base scenario is that the index could extend its rebound toward the 6,730–6,750 region. This area represents the nearest resistance zone, as it aligns with the cluster of moving averages on the H4 chart. If buying pressure proves insufficient to break above this level, the market may continue to trade within a consolidation phase before establishing a clearer directional trend.
From a macro perspective, the U.S. equity market is still closely monitoring signals from the Federal Reserve regarding the future interest-rate path. Expectations that the Fed may maintain a cautious monetary stance for some time are making capital flows within equities more selective, particularly after the strong rally seen in major indices earlier in the year.
交易开始

Join our group and unlock real-time Forex, gold, and crypto signals — sharp insights, fast alerts, and opportunities you don’t want to miss.
Join now: t.me/+dfxDTk_DRtg4Mzll
Join now: t.me/+dfxDTk_DRtg4Mzll
相关出版物
免责声明
这些信息和出版物并非旨在提供,也不构成TradingView提供或认可的任何形式的财务、投资、交易或其他类型的建议或推荐。请阅读使用条款了解更多信息。
Join our group and unlock real-time Forex, gold, and crypto signals — sharp insights, fast alerts, and opportunities you don’t want to miss.
Join now: t.me/+dfxDTk_DRtg4Mzll
Join now: t.me/+dfxDTk_DRtg4Mzll
相关出版物
免责声明
这些信息和出版物并非旨在提供,也不构成TradingView提供或认可的任何形式的财务、投资、交易或其他类型的建议或推荐。请阅读使用条款了解更多信息。