
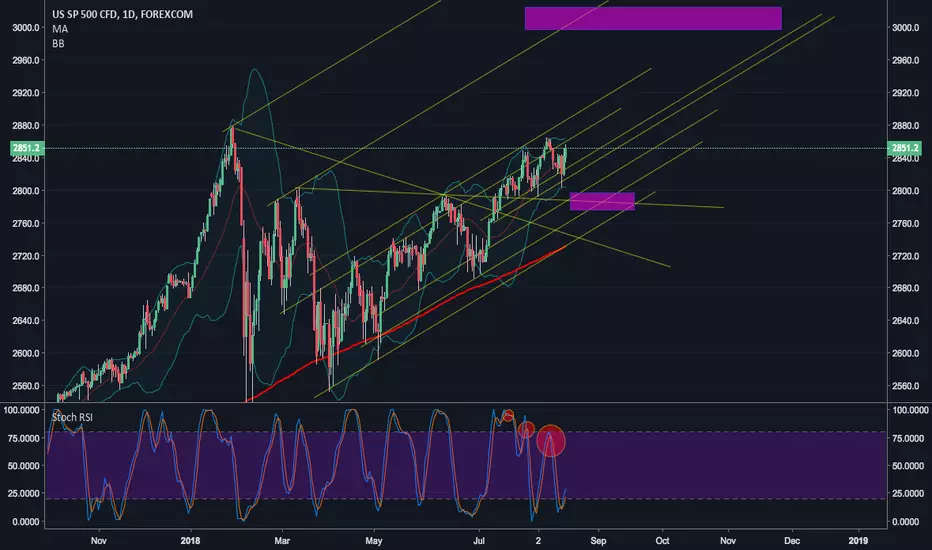
The SP 500 is stair-stepping up parallel support lines, whilst butting up against parallel lines set by March intraday lows. This is technically bullish, and implies that a breakout to the next parallel line is in the cards.
The only concerning point is the successive Stoch RSI bearish divergence. While excessively bullish markets will ignore bearish divergence (and vice versa for bearish markets), the fact that price is close to parallel resistance might suggest that a temporary high could form.
With that said, if a pullback can hold above the breakout line, which is confluence of the parallel lines that have held for the balance of the year, this would be incredibly bullish, and would project a measured move to the 3000 level.
The only concerning point is the successive Stoch RSI bearish divergence. While excessively bullish markets will ignore bearish divergence (and vice versa for bearish markets), the fact that price is close to parallel resistance might suggest that a temporary high could form.
With that said, if a pullback can hold above the breakout line, which is confluence of the parallel lines that have held for the balance of the year, this would be incredibly bullish, and would project a measured move to the 3000 level.

免责声明
这些信息和出版物并非旨在提供,也不构成TradingView提供或认可的任何形式的财务、投资、交易或其他类型的建议或推荐。请阅读使用条款了解更多信息。
免责声明
这些信息和出版物并非旨在提供,也不构成TradingView提供或认可的任何形式的财务、投资、交易或其他类型的建议或推荐。请阅读使用条款了解更多信息。