
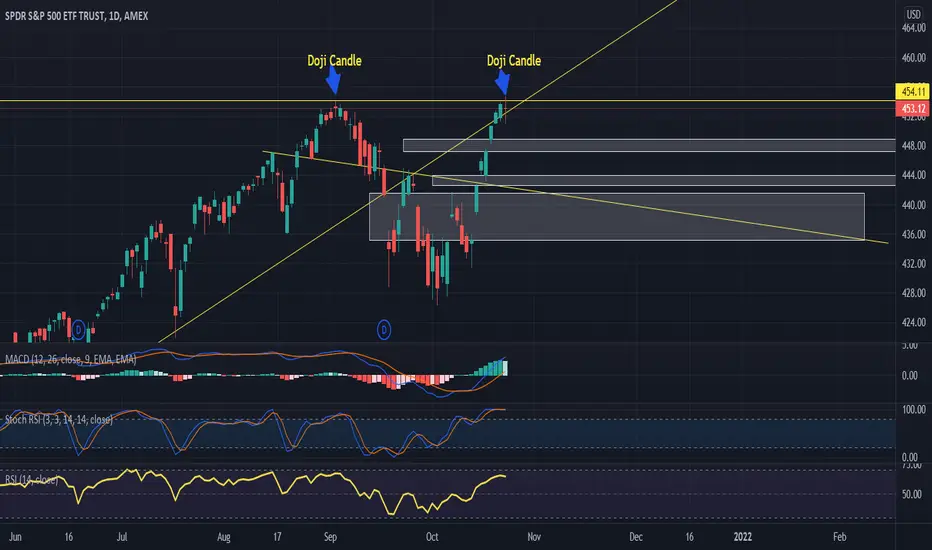
SPY, doji candle formed on the daily chart. A doji candle signals a reversal in direction for the specific stock/etf.
Also this could have formed what is known as a "double top" a double top is known as a bearish pattern in technical analysis. Also next week has a lot of earnings so expect some volatility in the market.
SPY seeing $449 is a possibility. After that we can see $447
Also this could have formed what is known as a "double top" a double top is known as a bearish pattern in technical analysis. Also next week has a lot of earnings so expect some volatility in the market.
SPY seeing $449 is a possibility. After that we can see $447

免责声明
这些信息和出版物并非旨在提供,也不构成TradingView提供或认可的任何形式的财务、投资、交易或其他类型的建议或推荐。请阅读使用条款了解更多信息。