
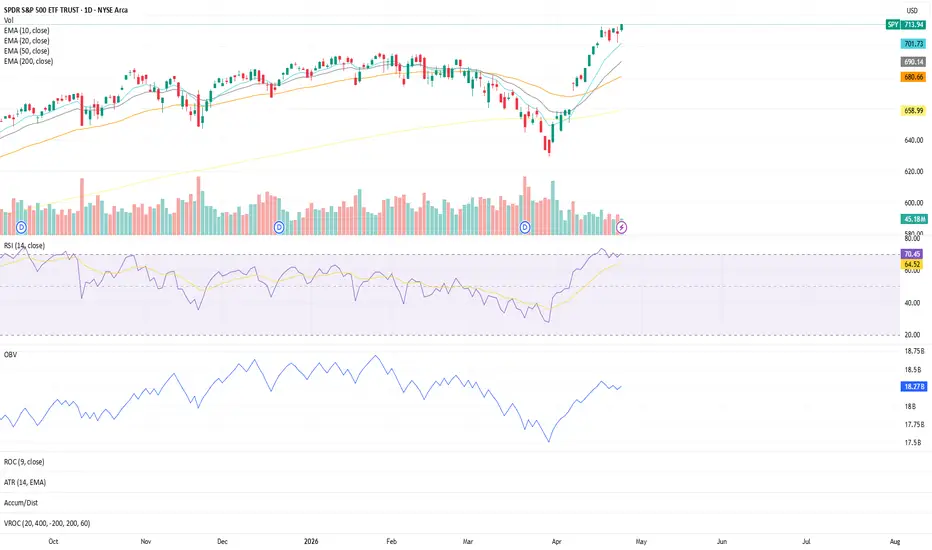
Price continues to respect short-term momentum structure as the trend rebuilds off the recent pullback.
The 10 & 20 EMAs are maintaining upward curvature, showing sustained short-term momentum
The 50 EMA has turned higher as well, though with a more gradual slope — indicating developing support rather than aggressive expansion
The 200 EMA continues its steady upward trajectory, keeping the broader structure intact
Since the March 30th pivot, both RSI and OBV have shown constructive behavior:
RSI holding in the upper range → consistent participation
OBV trending higher → confirming accumulation rather than divergence
This combination suggests the move is being supported, not just price-driven.
What I’m Watching:
Whether price can hold above the rising 10/20 EMA cluster on any pullbacks
If the 50 EMA begins to accelerate, aligning more closely with short-term momentum
Continued confirmation from OBV (no divergence) and RSI holding above midline
Any signs of compression vs expansion (ATR behavior) as price approaches local highs
At this stage, structure remains constructive, but monitoring how price behaves near these levels will help determine whether this is continuation or early signs of exhaustion.
⭐️ Final Clarity Note ⭐️:
This is a structure-based observation, not a prediction — focusing on alignment between trend, momentum, and participation.
The 10 & 20 EMAs are maintaining upward curvature, showing sustained short-term momentum
The 50 EMA has turned higher as well, though with a more gradual slope — indicating developing support rather than aggressive expansion
The 200 EMA continues its steady upward trajectory, keeping the broader structure intact
Since the March 30th pivot, both RSI and OBV have shown constructive behavior:
RSI holding in the upper range → consistent participation
OBV trending higher → confirming accumulation rather than divergence
This combination suggests the move is being supported, not just price-driven.
What I’m Watching:
Whether price can hold above the rising 10/20 EMA cluster on any pullbacks
If the 50 EMA begins to accelerate, aligning more closely with short-term momentum
Continued confirmation from OBV (no divergence) and RSI holding above midline
Any signs of compression vs expansion (ATR behavior) as price approaches local highs
At this stage, structure remains constructive, but monitoring how price behaves near these levels will help determine whether this is continuation or early signs of exhaustion.
⭐️ Final Clarity Note ⭐️:
This is a structure-based observation, not a prediction — focusing on alignment between trend, momentum, and participation.

免责声明
这些信息和出版物并非旨在提供,也不构成TradingView提供或认可的任何形式的财务、投资、交易或其他类型的建议或推荐。请阅读使用条款了解更多信息。
免责声明
这些信息和出版物并非旨在提供,也不构成TradingView提供或认可的任何形式的财务、投资、交易或其他类型的建议或推荐。请阅读使用条款了解更多信息。