
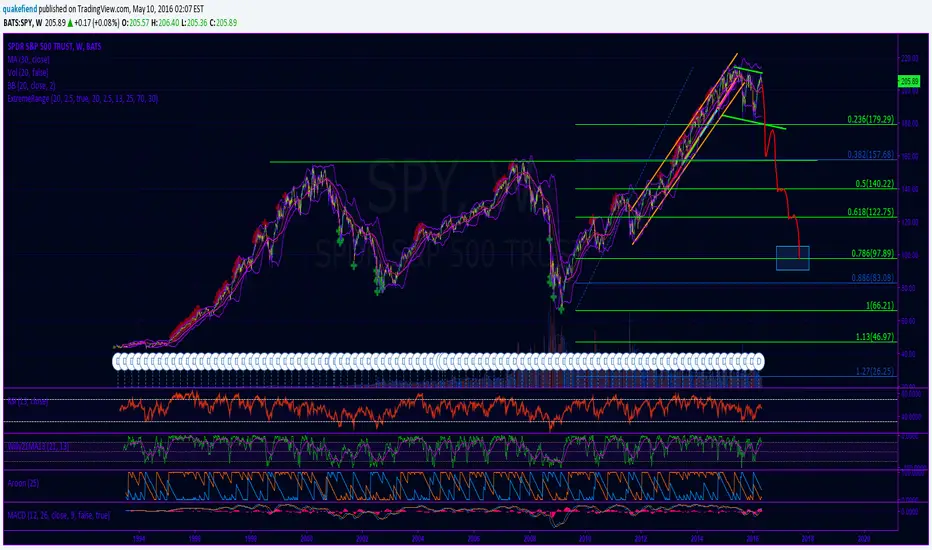
The left side of the blue target box is at the number of months the 2000 dot com bubble took to reach swing low. The right side is the number of months the 2008 crisis took to reach swing low. The top of the box is the % drop of the 2000 dot com bust, and the bottom of the box is the % drop of the 2008 crisis. Interestingly, the average of the 2 is almost exactly the .786 retracement from the last swing low after the 2008 crisis and the recent swing high in late 2015.
here is my analysis:
2000 correction (dot com bubble)
155.75 to 77.07 : 50.5% drop
High of 155.75 at March 2000, low of 77.07 at October 2002 : 32 months
2008 correction (housing bubble)
157.52 to 67.10 : 57.4% drop
High of 157.52 at October 2007, low of 67.10 at March 2009 : 18 months
2016 correction (dollar bubble [quantitative easing])
50.5% drop from 213.78 : 105.82
57.4% drop from 213.78 : 91.07
average: 98.45
High of 213.78 in May 2015
possible time frame to reach low: between November 2016 and January 2018 (32 months)

免责声明
这些信息和出版物并非旨在提供,也不构成TradingView提供或认可的任何形式的财务、投资、交易或其他类型的建议或推荐。请阅读使用条款了解更多信息。
免责声明
这些信息和出版物并非旨在提供,也不构成TradingView提供或认可的任何形式的财务、投资、交易或其他类型的建议或推荐。请阅读使用条款了解更多信息。