
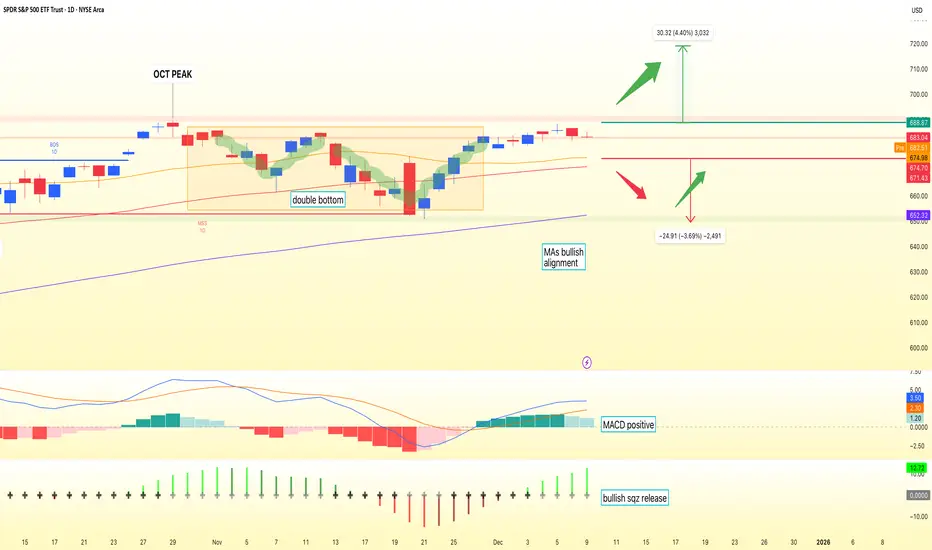
SPY is still riding a clean 1D uptrend, holding above the 20, 60 and 120-day moving averages, with multiple upside BOS confirming bullish structure. The recent MSS in November and the emerging Double Top around 688 had already injected some caution, but the latest 25 bps Fed cut changes the backdrop. Easier policy generally supports risk assets, yet the key is always the market’s reaction: does price accept higher levels, or do we see a “sell the news” fade from resistance? For now, SPY remains trapped between supply near 688 and demand around 655, the neckline of the recent pullback.
My primary path leans bullish with the Fed cut acting as a tailwind. A decisive daily close above 688–689 would invalidate the Double Top narrative, signaling that buyers have fully absorbed supply at this zone. If that breakout holds, upside continuation toward 695 and then 705–719 comes into focus, as long as price stays above the 20-day MA near 675.
If instead SPY fails to clear 688 and closes back below 680 and then 675, it would suggest the cut was already priced in and sellers are fading strength. In that scenario, I’d watch 670, then 660, with 655 as the critical neckline. A daily close below 655 would confirm the Double Top and open room for a deeper correction. This is a study, not financial advice. Manage risk and invalidations.
Thought of the Day 💡: News is the spark, structure is the map—trade the reaction, not the headline.
-------------------------
Thanks for your support!
If you found this idea helpful or learned something new, drop a like 👍 and leave a comment, I’d love to hear your thoughts!
My primary path leans bullish with the Fed cut acting as a tailwind. A decisive daily close above 688–689 would invalidate the Double Top narrative, signaling that buyers have fully absorbed supply at this zone. If that breakout holds, upside continuation toward 695 and then 705–719 comes into focus, as long as price stays above the 20-day MA near 675.
If instead SPY fails to clear 688 and closes back below 680 and then 675, it would suggest the cut was already priced in and sellers are fading strength. In that scenario, I’d watch 670, then 660, with 655 as the critical neckline. A daily close below 655 would confirm the Double Top and open room for a deeper correction. This is a study, not financial advice. Manage risk and invalidations.
Thought of the Day 💡: News is the spark, structure is the map—trade the reaction, not the headline.
-------------------------
Thanks for your support!
If you found this idea helpful or learned something new, drop a like 👍 and leave a comment, I’d love to hear your thoughts!

follow my X 👉 x.com/bbqgio
🔥 level up your Stock, FX, & Crypto: VIP access to AI technical analysis and pro market insights at TradeOS + 50%-off promo code ONBOARD 👉
ai.tradeos.xyz/?utm_source=tvbg
🔥 level up your Stock, FX, & Crypto: VIP access to AI technical analysis and pro market insights at TradeOS + 50%-off promo code ONBOARD 👉
ai.tradeos.xyz/?utm_source=tvbg
相关出版物
免责声明
这些信息和出版物并非旨在提供,也不构成TradingView提供或认可的任何形式的财务、投资、交易或其他类型的建议或推荐。请阅读使用条款了解更多信息。
follow my X 👉 x.com/bbqgio
🔥 level up your Stock, FX, & Crypto: VIP access to AI technical analysis and pro market insights at TradeOS + 50%-off promo code ONBOARD 👉
ai.tradeos.xyz/?utm_source=tvbg
🔥 level up your Stock, FX, & Crypto: VIP access to AI technical analysis and pro market insights at TradeOS + 50%-off promo code ONBOARD 👉
ai.tradeos.xyz/?utm_source=tvbg
相关出版物
免责声明
这些信息和出版物并非旨在提供,也不构成TradingView提供或认可的任何形式的财务、投资、交易或其他类型的建议或推荐。请阅读使用条款了解更多信息。