
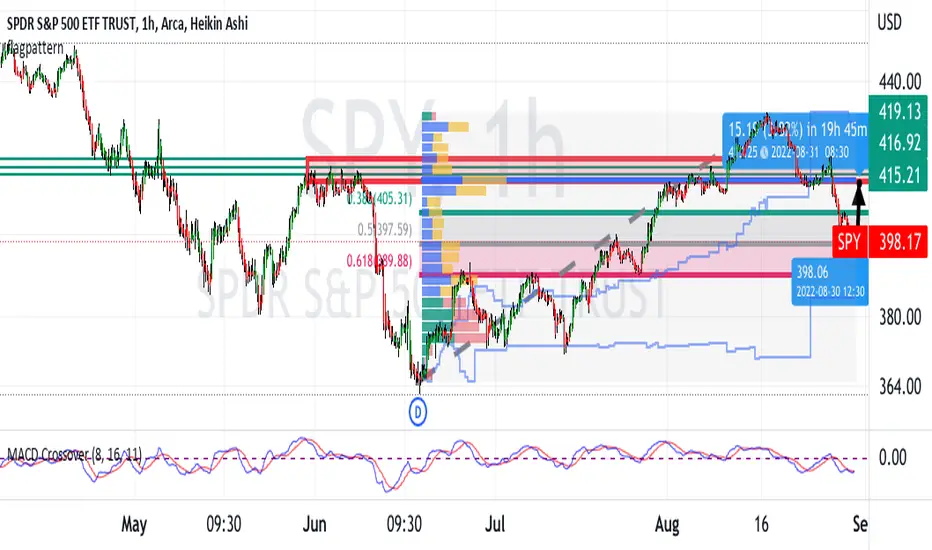
SPY bottomed June 17th and then uptrended for exactly two months and
reversed on August 16th. In this hourly chart , I show that the downtrend
retraced the uptrend to exactly the Fibonacci level 0.5
Resistance above is (1) the triple top in June as well as consolidation
zones August 22-24 and August 3-5 making the resistance zone
414-419.
The Volume Profile POC is at the Fib 0.618 level while the upper
high volume node is at the above-described resistance zone.
All in all, I see the SPY bouncing off the Fib 0.5 or Fib 0.618
and making its move towards the resistance zone.
I will play this with call options expiring September 7th.
If resistance breaks, I will close a portion of the calls
and let the rest run. If it holds, I will close them all and
roll over the profit into out of the money put options
expiring September 9th.
Please comment, what do you think?
reversed on August 16th. In this hourly chart , I show that the downtrend
retraced the uptrend to exactly the Fibonacci level 0.5
Resistance above is (1) the triple top in June as well as consolidation
zones August 22-24 and August 3-5 making the resistance zone
414-419.
The Volume Profile POC is at the Fib 0.618 level while the upper
high volume node is at the above-described resistance zone.
All in all, I see the SPY bouncing off the Fib 0.5 or Fib 0.618
and making its move towards the resistance zone.
I will play this with call options expiring September 7th.
If resistance breaks, I will close a portion of the calls
and let the rest run. If it holds, I will close them all and
roll over the profit into out of the money put options
expiring September 9th.
Please comment, what do you think?

免责声明
这些信息和出版物并非旨在提供,也不构成TradingView提供或认可的任何形式的财务、投资、交易或其他类型的建议或推荐。请阅读使用条款了解更多信息。
免责声明
这些信息和出版物并非旨在提供,也不构成TradingView提供或认可的任何形式的财务、投资、交易或其他类型的建议或推荐。请阅读使用条款了解更多信息。