
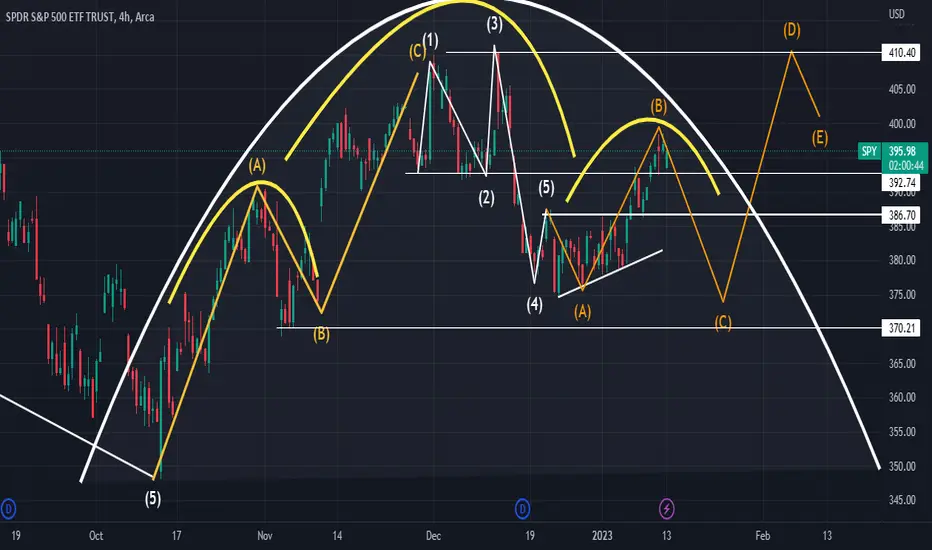
from the 5th wave we saw a rise to 4000 on the spx, however momentum is breaking down and there is a rounding top pattern forming here w/ a head and shoulders inside it... bearish, shorting to C wave 3856 area needs to hold or we trade below jan-dec accumulation levels
注释
A-C-E Sets up the inverted head and shoulders on the 4hr chart 注释
注释
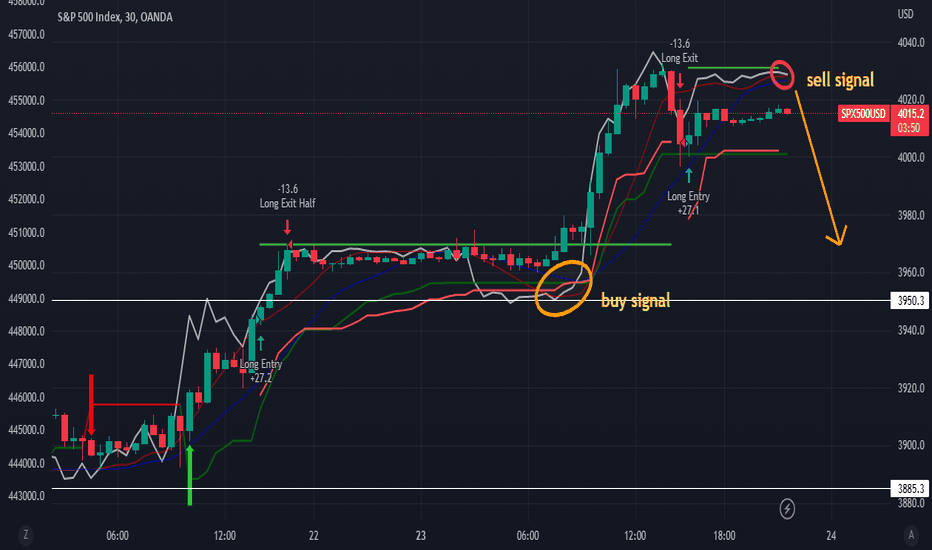
30min time frame 注释
1hr time frame of  SPX (futures) similar patterns, likely leads us to sell off in the premarket
 注释
updated view 注释
any bounce should be considered a short opportunity注释
Speaking of Bounce, on a prev. chart. I showed the rising wedge, look for possible bounce near 3885 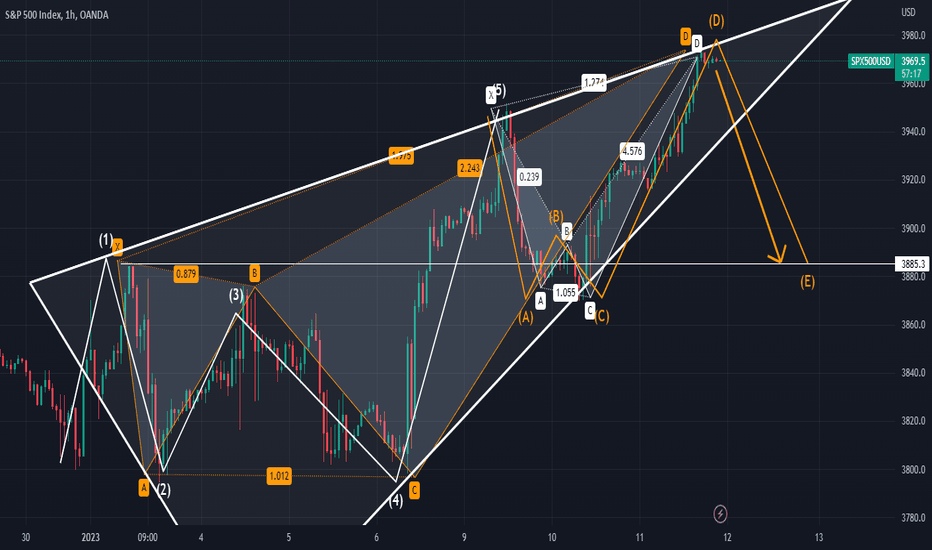
注释
Wave 1, previous resistances... previous resistances should test as support area if you truly believe this is a bull market. If it fails, and its possible (after a brief bounce) then look for price action trade under Dec-Jan consolidation注释
If we trade under Dec-Jan consolidation, then take a look at this chart 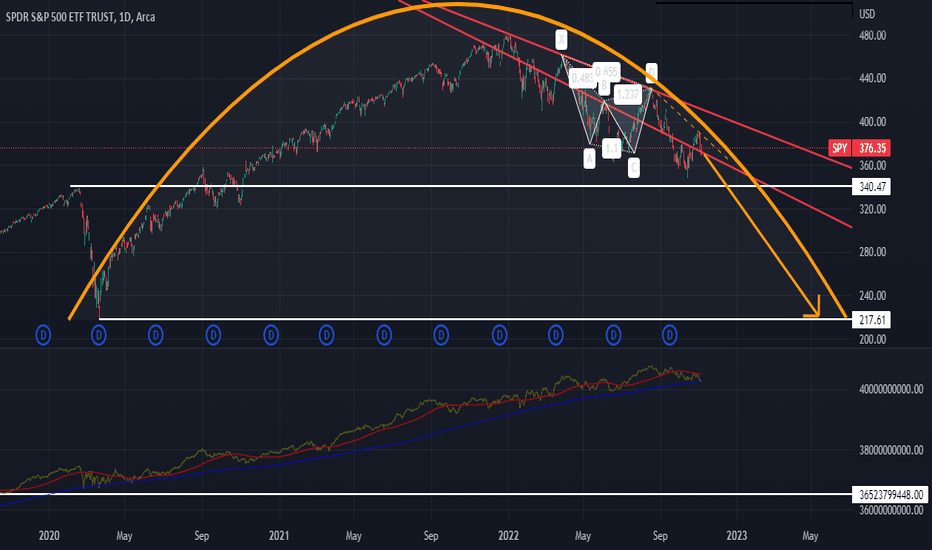
注释
you see the Daily rounding top now above? But notice on this thread we're on the 4hr time frame (this thread/post)... that bearish sentiment could easily carry over to the daily time frame. this is why you have to trade between multiple time frames.注释
注释
why I closed my short positions 注释
looking for $3950-3960 bounce back to the 5th Wave注释
looking for bullish reversal set up here 注释
注释
and boom 注释
交易开始
I hope yall in profits, shorts are back on注释
cup and handle forming , im short the handle... handle could fail here ... but im risking it.. based on my TA 注释
注释
notice the rejections inside the handle that is forming, the next move will be very similar to the move up from 3885注释
注释
注释
head and shoulders money flow 注释
head and shoulders inside the cup and handle pattern 注释
3950 was the buy zone, will likely re-short 3997注释
shorts is back on since the c wave buy from 3950 注释
there is a bullish cypher in disguise 注释
step into the mind of a market maker. 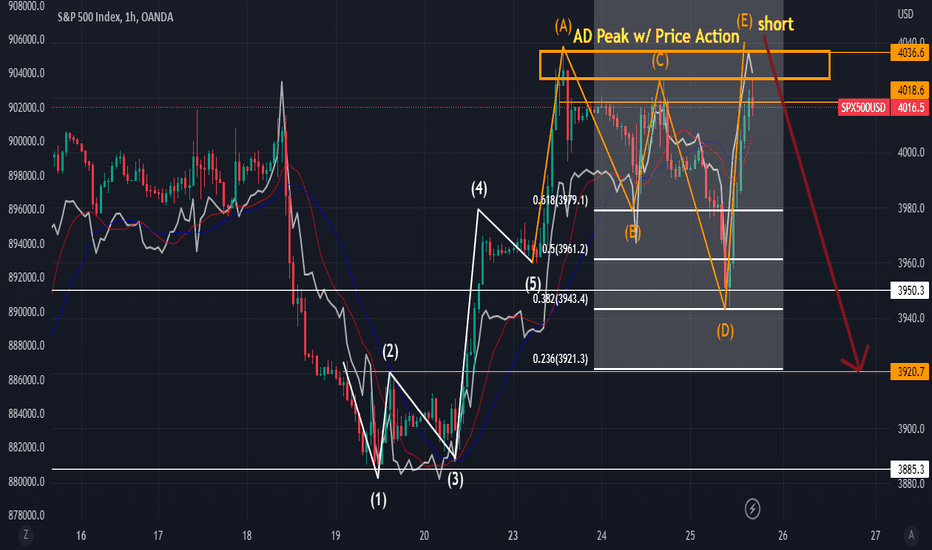
注释
注释
注释
live chart 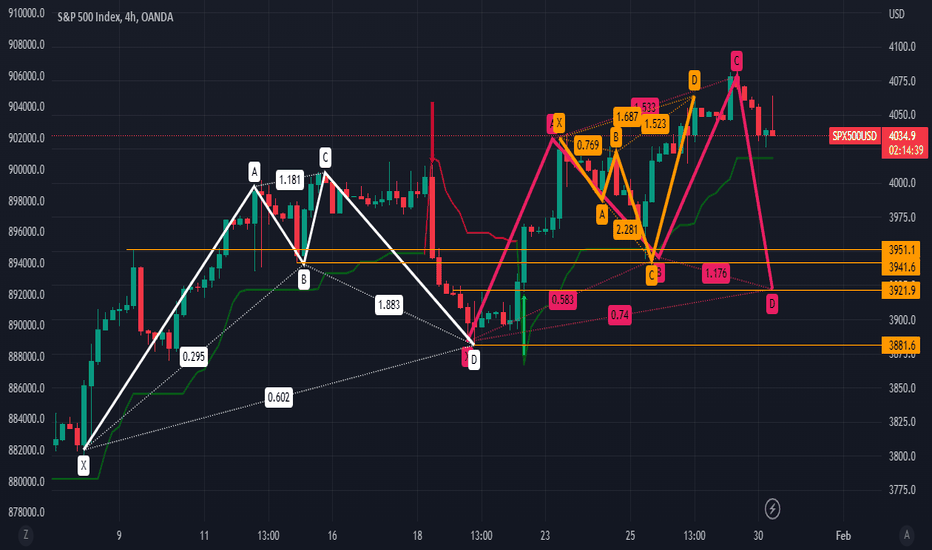
注释
monitoring this abcd pattern set up 注释
注释
注释
注释
push it to 400 注释
this is a buy level注释
dumping of the dividends 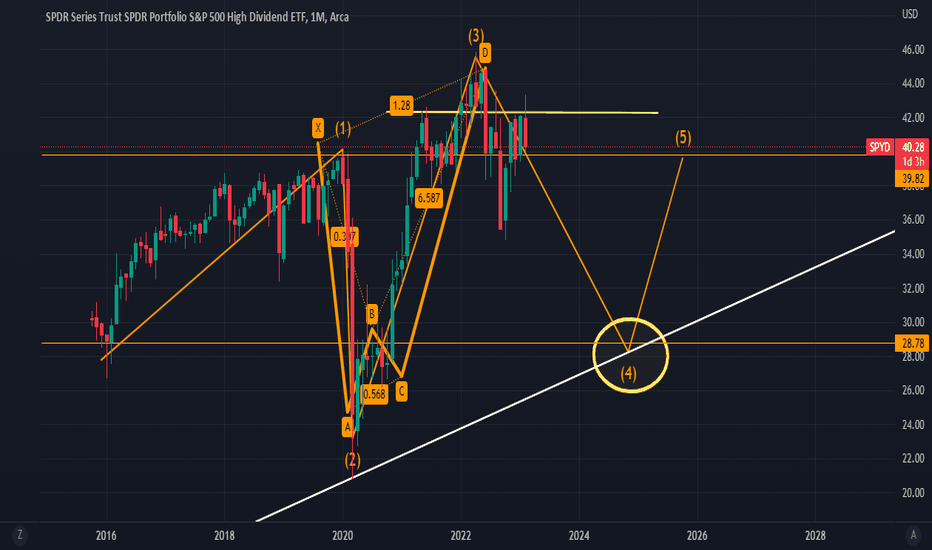
注释
1hr double bottom by Ad+ price action . you dont have the 1hr h/s breach yet, only on smaller time frames 注释
price action breakout 注释
405 still my target for this next run up bullish cypher pattern set up 注释
I took profits above and currently short spy via puts.. looking for 402 to print 注释
why im in puts 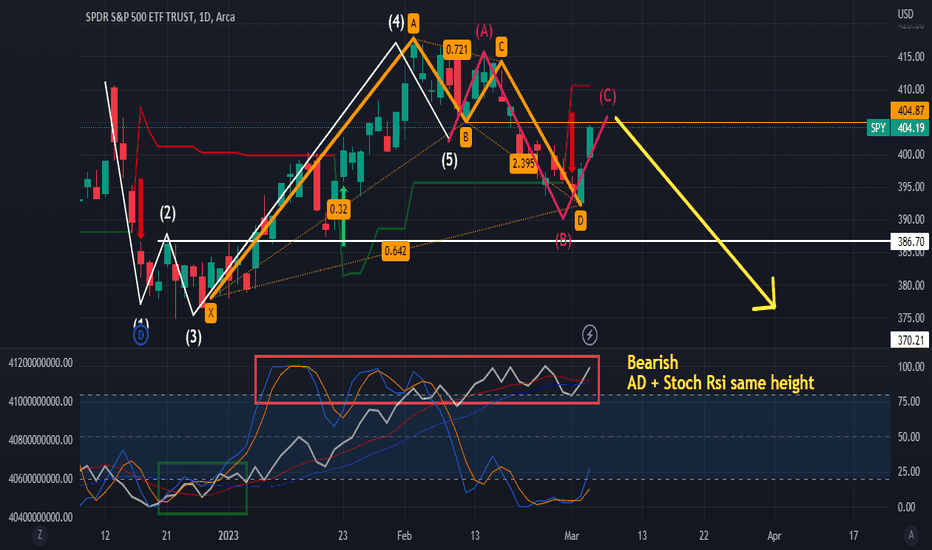
注释
交易手动结束
we bounced off the 5th wave. Closed shorts Friday. looking for a move up to $398 Spy minimum retest, and potential move to $408.. Long positions tonight enter on futures, and looking to short inverse bear etfs financials, bear etf on sp500 like spxs at opening or near
免责声明
这些信息和出版物并非旨在提供,也不构成TradingView提供或认可的任何形式的财务、投资、交易或其他类型的建议或推荐。请阅读使用条款了解更多信息。
免责声明
这些信息和出版物并非旨在提供,也不构成TradingView提供或认可的任何形式的财务、投资、交易或其他类型的建议或推荐。请阅读使用条款了解更多信息。