
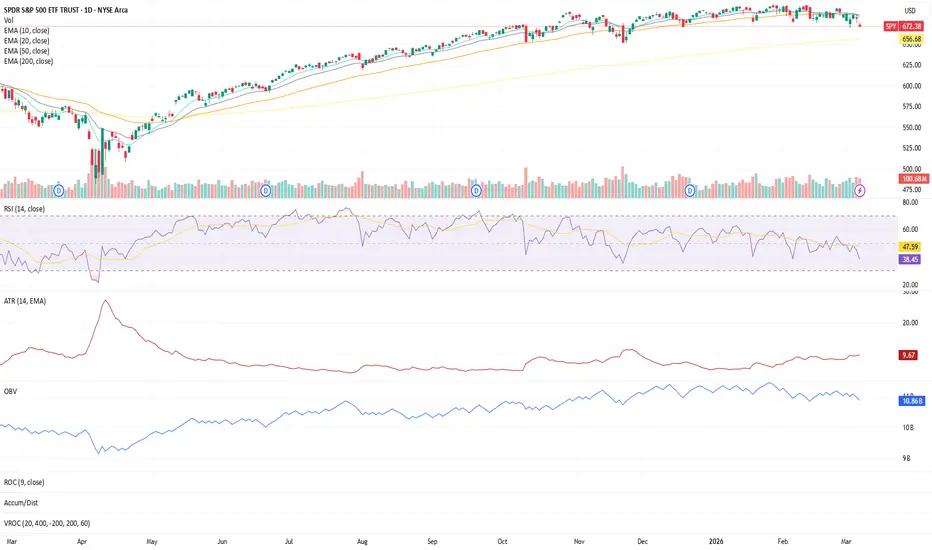
Structure is beginning to show signs of short-term pressure.
On the daily chart, the 10 EMA and 20 EMA have now crossed below the 50 EMA, with price closing beneath both short-term averages. This signals weakening short-term momentum as buyers step back from recent highs.
Despite the near-term shift, price remains above the 200 EMA, which continues to act as the broader structural support for the longer-term trend.
Current indicator observations:
• RSI (14) operating in weaker territory, reflecting increasing downside momentum on the daily timeframe
• ATR holding relatively steady — no clear volatility expansion or compression developing
• OBV remains elevated overall but appears to be taking a breather after the prior advance
At this stage, the chart is showing momentum cooling rather than a confirmed structural breakdown.
Acceptance back above the short-term averages would signal stabilization, while continued weakness could invite further testing of deeper support zones.
Structure > Emotion.
On the daily chart, the 10 EMA and 20 EMA have now crossed below the 50 EMA, with price closing beneath both short-term averages. This signals weakening short-term momentum as buyers step back from recent highs.
Despite the near-term shift, price remains above the 200 EMA, which continues to act as the broader structural support for the longer-term trend.
Current indicator observations:
• RSI (14) operating in weaker territory, reflecting increasing downside momentum on the daily timeframe
• ATR holding relatively steady — no clear volatility expansion or compression developing
• OBV remains elevated overall but appears to be taking a breather after the prior advance
At this stage, the chart is showing momentum cooling rather than a confirmed structural breakdown.
Acceptance back above the short-term averages would signal stabilization, while continued weakness could invite further testing of deeper support zones.
Structure > Emotion.

免责声明
这些信息和出版物并非旨在提供,也不构成TradingView提供或认可的任何形式的财务、投资、交易或其他类型的建议或推荐。请阅读使用条款了解更多信息。
免责声明
这些信息和出版物并非旨在提供,也不构成TradingView提供或认可的任何形式的财务、投资、交易或其他类型的建议或推荐。请阅读使用条款了解更多信息。