
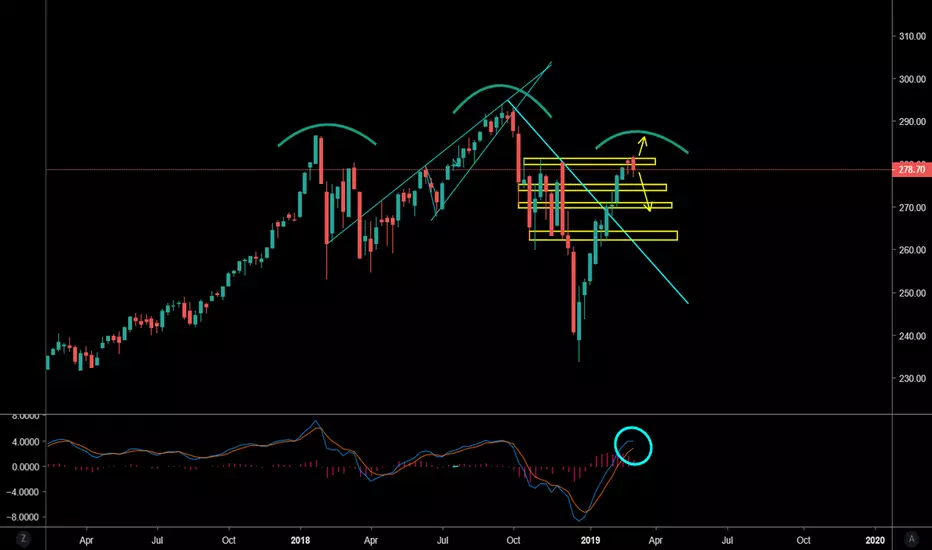
I have posted an IWM chart not too long ago but from the daily chart perspective. Here we have a SPY weekly chart with some areas to keep on watch. We have finally come into an area of strong resistance and finally some red juicy candles. Now of course resistance can be broken to the upside and we do have a trade deal on the horizon in which trump tweets an update every weekend about. On the larger picture we have a head and shoulders topping pattern which could lead to some bad turbulence in the coming weeks. So just keep watch for the yellow boxed levels and be safe in the coming weeks. Also keep watch on IWM as it was the first to go last year before SPY, also watch Gold as it has had a pullback for a couple days and could be ready for another leg higher. Weed stocks also tend to move when the markets become shaky and if you'd like, I have some charts for the weed players in which today alone made me more than I make a month of working for a bank. Goodnight everyone. Cheers!

免责声明
这些信息和出版物并非旨在提供,也不构成TradingView提供或认可的任何形式的财务、投资、交易或其他类型的建议或推荐。请阅读使用条款了解更多信息。