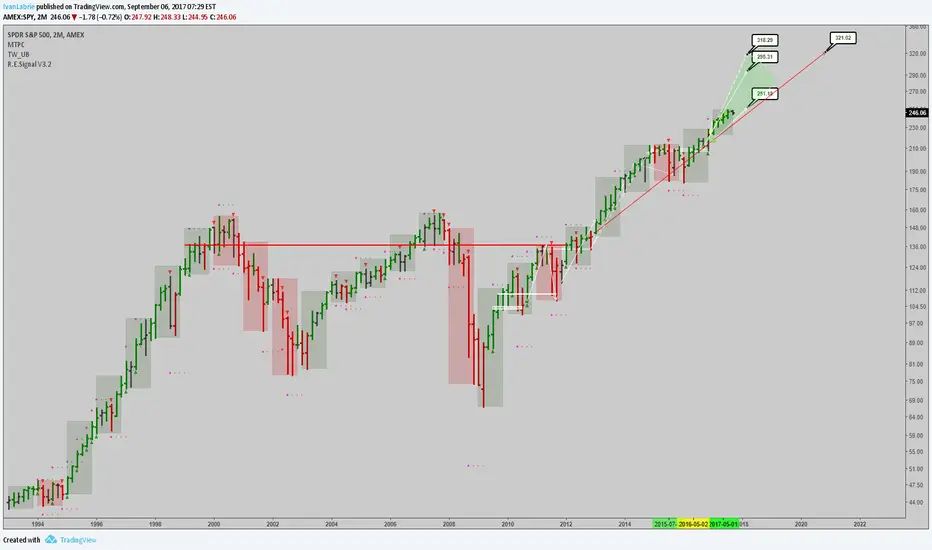
This is an updated forecast chart for $SPY. The weekly chart has more nuances that might help predict the intermediate term turns and corrections, but overall, this is the path that is possible according to the long term charts. I'm long but not buying the market directly, in general, instead I focus on stock picking to try and outperform. Sentiment has been negative all the way up, it's interesting how people's perception is affected by recent events, that shocked them -the 2007 financial crisis-, and many have missed the whole rally since 2009, or lost their shirt hedging or trying to short, buying volatility, etc.
Best of luck,
Ivan Labrie.
Best of luck,
Ivan Labrie.
注释
注释
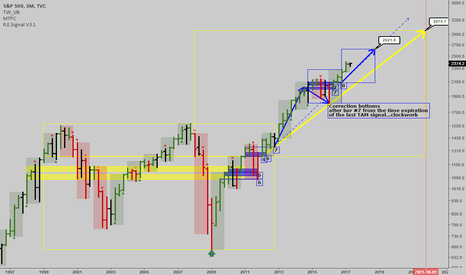
The chart implies a period of sideways action for roughly 20 months starting in March. I bought  SPY today, I'll try to buy the bottom of the range each time, and short at the tops to increase my position for longer term upside after it eventually trends again.
注释
注释
I'm long from 275.83, roughly, but we have been buying and selling swings from 261.1. Cost basis is a lot lower, but that's our last entry.I am looking to bank our gains near 286, the timing for a top here aligns the daily and 2 month timeframe signals.
注释
Top near 286, time until March 26th...Could top sooner, resistance right above Friday's high.
Let's wait and see.
注释
Smart money supported the market again when retesting the peak of their buying spree range. If  VIX falls to 12.9, we will have a new support zone to label on chart
注释
#SPY could rally towards $293 or as high as $300 if the weekly trend is valid 注释

Public, timestamped track record. Free month of the desk: ivanlabrie.netlify.app
相关出版物
免责声明
这些信息和出版物并非旨在提供,也不构成TradingView提供或认可的任何形式的财务、投资、交易或其他类型的建议或推荐。请阅读使用条款了解更多信息。
Public, timestamped track record. Free month of the desk: ivanlabrie.netlify.app
相关出版物
免责声明
这些信息和出版物并非旨在提供,也不构成TradingView提供或认可的任何形式的财务、投资、交易或其他类型的建议或推荐。请阅读使用条款了解更多信息。