
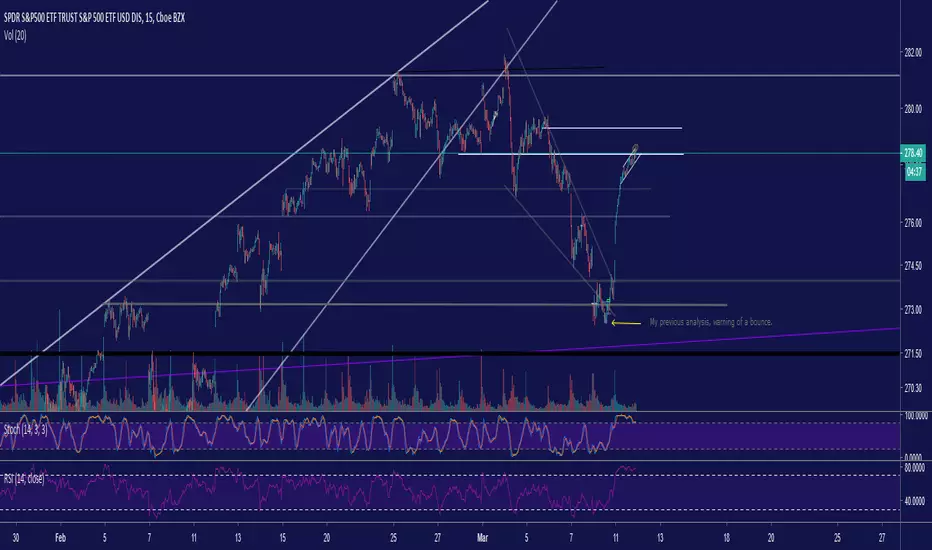
My post Friday, warned of a bounce coming soon and it mentioned covering shorter term trades. Please refer to the attached "related idea" at the bottom.
Now we have gotten a nice little bounce, it already looks like it's trying to top to me. It could top here or surge higher to 279.30 or 281. But regardless wherever it does top it will be the next best place to get out into the safety of cash (or short) if you hadn't done so already last week.
If we make it all the way back up to the top at 281 area then I would be cautious of a break above that horizontal level, if that happens then we could see a retest of the yearly highs. This is an unlikely scenario in my opinion, but anything could happen, which is why closing out of shorts or re-entering the market long, if we do break 281 would be responsible for managing risk.
My analysis tells me that the odds are; we have just put in the last high point this market will see in a long time. Watch for the reversal by breaking this flag's support line, and then expect things to fall apart. This flag is ascending in nature, which leads to an impulsive break down if we break the support.
30 minutes until the market closes, so we will get to see which way this thing goes pretty soon.
注释
On a small timeframe scale (5 min) we are getting nice High Volume... you know what that means...potential topping volume. Keep your eyes on this area to see if it does in fact exhaust here注释
maybe so.... 注释
Flag decomposing, Potential reversal.注释
This area could be very significant in the long term. If we are in a bear market (which I believe) then this last 2 months has been its first rally, meaning this topping area will potentially be the highest point in a coming big bear market. The specific area that we are at currently is the first lower high off of the highs put in from the first Bear market rally. You tell me if that is significant or not...
注释
Watch for a break of the red line for entry potential and managing risk..注释
Plz observe Nasdaq QQQ Just broke its highs, while small caps IWM are incredibly unmoved by this bounce.注释
QQQ's looking to break back below its highs. Other indexes looking like they don't have the follow through at this point, I expect downside from here.注释
Let's see what Kind of Breakdowns we get from here to close... Tomorrow will likely be the real down movements as there are only 3 hours left in today's markets. If you are in mutual funds that only execute orders at the end of the day, then you may have a Lucky opportunity today for that. 注释
Please keep an eye on QQQ breaking back below its highs of this 2 month bounce at 175.80注释
401k money or mutual fund orders-- that only execute at the close of the day ... Should strongly be considered today.注释
GET READY!!!! IWM ... QQQ and SPY all starting to break todays structures... Special attention on QQQ
注释
Selling for the next hour and possibly in the futures tonight as well注释
SPY - just started breaking some structure as well注释
As well as Small Caps注释
Sorry---- That was SPY --- Here are the small caps..i cannot post this fast enough IWM- Russell
注释
Nasdaq retesting its that major horizontal level.... IMO Futures tonight will be down on all of the markets.. Expect large gap tomorrow morning. 注释
I am not convinced that this is impulsive with breakout volume breakout to the upside. It looks more like another stop hunt.
注释
Derisking shorts until a break back down below the top would be responsible. But you would need to be quick about the rebreak at 281.86 if it occurs things will drop quickly, as it would be a bull trap/throw-over注释
注释
Watch either green box territory for a break注释
GG- Love that adrenaline >>> This thing is starting to break down its levels and will likely continue and accelerate. We didn't have a breakthrough volume on that break of resistance. Price was forced up there but it was not organic, everyone trying to jump in on that trade.. We will see how this develops, but usually, stop hunts / traps are followed through nicely. 注释
注释
注释
I have adjusted my "Rectangles of Risk Management" for the potential for a bull flag breakout to the upside, still not favored outcome IMO, but to keep it fresh. 注释
Care on the structural breakup.
注释
注释
281.86 Very Small baby support broke.注释
Be careful here we are attempting to break top of this Resistance 注释
This is NOT what you want to see for a breakout trade. Bad volume, and instant rejection below levels. The green box at 282 is where you would now want to watch. 注释
注释
Although we wicked down, there was no signs of Bottoming Volume to show conviction in buying/supporting that wicks price level.注释
注释
In the sands of time, I believe these levels will be very historically important.
相关出版物
免责声明
这些信息和出版物并非旨在提供,也不构成TradingView提供或认可的任何形式的财务、投资、交易或其他类型的建议或推荐。请阅读使用条款了解更多信息。