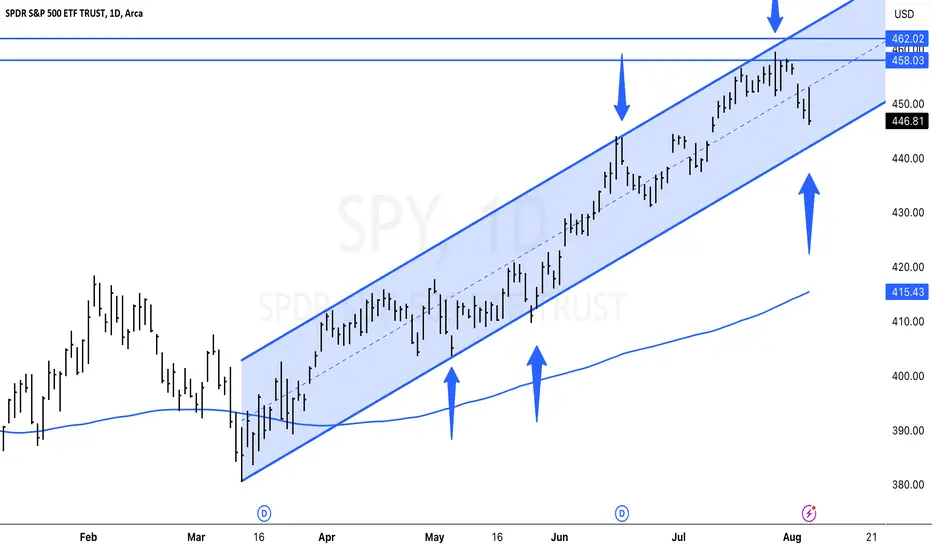
he  SPY is still in a parallel uptrend. The trend line has been in place since March 2023, and it has helped to support the stock market during periods of volatility. If the trend line breaks, the next support level will be at the 150-day moving average. This is a key level to watch, as a break below it could signal a more significant decline in the stock market.
However, it is important to remember that the stock market is cyclical, and it is normal for there to be periods of volatility. TheSPY has been in an uptrend for the past year, and it is possible that the trend line will continue to hold. If the trend line does break, it is important to stay calm and to not panic sell. Instead, you should wait for the stock market to find a bottom and then start buying again.
SPY is still in a parallel uptrend. The trend line has been in place since March 2023, and it has helped to support the stock market during periods of volatility. If the trend line breaks, the next support level will be at the 150-day moving average. This is a key level to watch, as a break below it could signal a more significant decline in the stock market.However, it is important to remember that the stock market is cyclical, and it is normal for there to be periods of volatility. The
SPY has been in an uptrend for the past year, and it is possible that the trend line will continue to hold. If the trend line does break, it is important to stay calm and to not panic sell. Instead, you should wait for the stock market to find a bottom and then start buying again.
免责声明
这些信息和出版物并非旨在提供,也不构成TradingView提供或认可的任何形式的财务、投资、交易或其他类型的建议或推荐。请阅读使用条款了解更多信息。
免责声明
这些信息和出版物并非旨在提供,也不构成TradingView提供或认可的任何形式的财务、投资、交易或其他类型的建议或推荐。请阅读使用条款了解更多信息。