
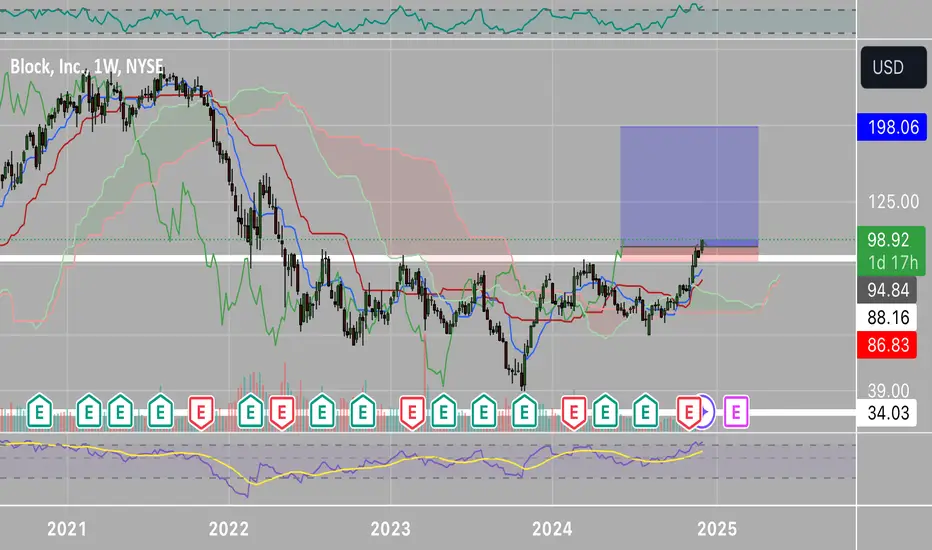
The weekly chart of Block, Inc. (SQ) displays a textbook inverse head and shoulders pattern, a classic bullish reversal setup. After consolidating within a range for an extended period, the price appears to have broken above the neckline, signaling potential upward momentum. The target range, indicated by the blue zone, aligns with historical resistance levels.
Key observations:
• Neckline breakout confirms the pattern.
• Support levels to watch: $86.83 and $88.16.
• Potential 🎯 Target: $198.06, aligning with previous highs.
• Indicators such as RSI and Ichimoku Cloud complement the bullish outlook.
This setup suggests a favorable risk-to-reward ratio, but patience is key.
Disclaimer: This analysis is for informational purposes only and should not be considered financial advice. Trading involves significant risk, and you should consult with a qualified financial advisor before making any investment decisions. Always perform your own research and analysis. Past performance does not guarantee future results.
Key observations:
• Neckline breakout confirms the pattern.
• Support levels to watch: $86.83 and $88.16.
• Potential 🎯 Target: $198.06, aligning with previous highs.
• Indicators such as RSI and Ichimoku Cloud complement the bullish outlook.
This setup suggests a favorable risk-to-reward ratio, but patience is key.
Disclaimer: This analysis is for informational purposes only and should not be considered financial advice. Trading involves significant risk, and you should consult with a qualified financial advisor before making any investment decisions. Always perform your own research and analysis. Past performance does not guarantee future results.

YouTube goo.gl/BkRuQL
Twitter twitter.com/vilasignal
Twitter twitter.com/vilasignal
免责声明
这些信息和出版物并非旨在提供,也不构成TradingView提供或认可的任何形式的财务、投资、交易或其他类型的建议或推荐。请阅读使用条款了解更多信息。
YouTube goo.gl/BkRuQL
Twitter twitter.com/vilasignal
Twitter twitter.com/vilasignal
免责声明
这些信息和出版物并非旨在提供,也不构成TradingView提供或认可的任何形式的财务、投资、交易或其他类型的建议或推荐。请阅读使用条款了解更多信息。