
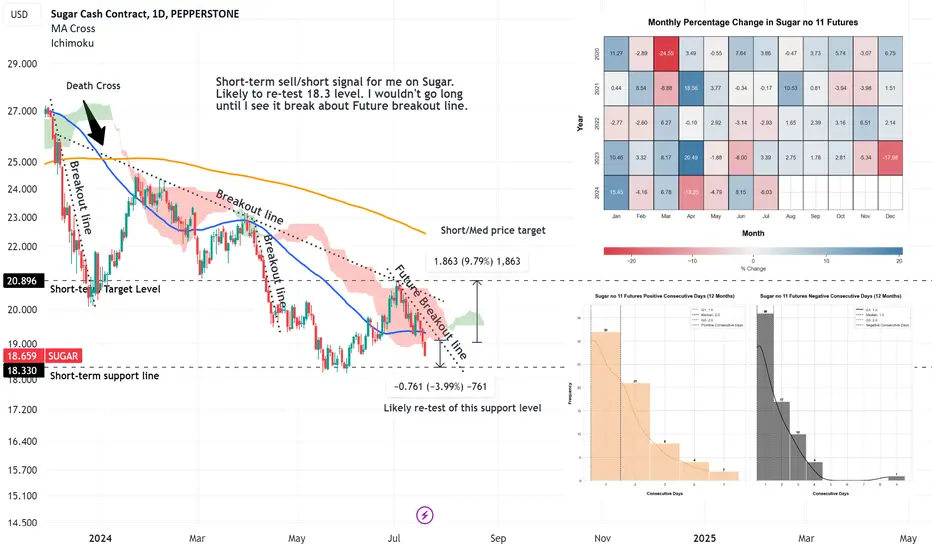
Short-term analysis of Sugar no11. Including 2 statistical charts showing the % monthly price changes over the last 5 years and a chart detailing the occurrence of consecutive positive and negative days "candles" and their frequency over 12 months.
- I expect more selling in July and then a rebound in August.
- Follow me on my socials for more detailed content
- I expect more selling in July and then a rebound in August.
- Follow me on my socials for more detailed content

免责声明
这些信息和出版物并非旨在提供,也不构成TradingView提供或认可的任何形式的财务、投资、交易或其他类型的建议或推荐。请阅读使用条款了解更多信息。
免责声明
这些信息和出版物并非旨在提供,也不构成TradingView提供或认可的任何形式的财务、投资、交易或其他类型的建议或推荐。请阅读使用条款了解更多信息。