
📊 Structural & Technical Analysis (SUIUSD)
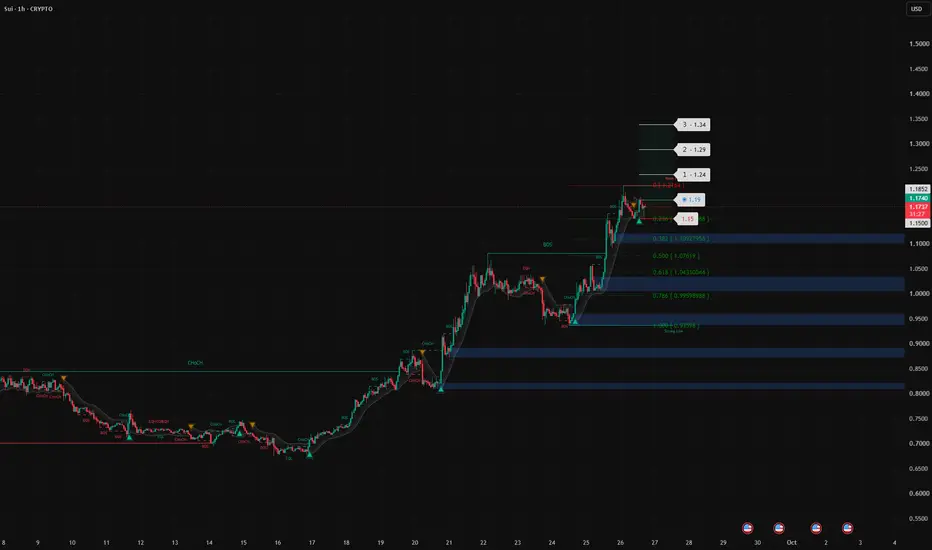
SUI (SUIUSD) is displaying a highly resilient structural framework on the 1-hour (1H) chart [image_bLUbSi.png]. Following a standard technical distribution phase from its local premium boundaries, the price action has successfully gravitated toward heavy horizontal accumulation shelves. The asset is printing a clear higher-low configuration, signaling that selling pressure is exhausting at major Fibonacci support levels.
Looking strictly at the precise technical geometry of the hourly chart:
1. Support Validation: The price is holding firm around the $1.1748 zone, actively defending the critical Fibonacci retracement floor [image_bLUbSi.png]. This structural cushion represents a high-confluence demand anchor where institutional buying interest is stepping back in.
2. Order Flow & Continuation: The market is currently consolidating, building local energy below structural overhead lines. A clean continuation past immediate micro-resistance will fully shift the short-term velocity back in alignment with the major impulse uptrend.
3. Invalidation Parameters: Risk parameters are structurally secure, with defensive coverage anchored beneath the absolute local swing floor to isolate the setup from any near-term liquidity-grab volatility.
🛠️ My Trading Plan (Upside Extensions):
• Entry Zone: Around $1.1748 (Positioning directly into the live stabilization base)
• Invalidation (Stop Loss): Placed strictly at $1.15 to safeguard core trading capital
• Target 1 (TP1): $1.24 (Immediate horizontal resistance shelf and near-term liquidity target)
• Target 2 (TP2): $1.29 (Primary swing target / High-volume supply boundary - Recommended)
• Target 3 (TP3): $1.34 (Major mathematical extension targeting previous local peaks)
What is your technical outlook on SUI as it builds a fresh structural floor above the Fibonacci grid? Let me know in the comments below, and don't forget to support this analysis with a boost!
*DISCLAIMER: This post is for educational and technical analysis purposes only. It does not constitute investment or financial advice. Always practice strict risk management.*
SUI (SUIUSD) is displaying a highly resilient structural framework on the 1-hour (1H) chart [image_bLUbSi.png]. Following a standard technical distribution phase from its local premium boundaries, the price action has successfully gravitated toward heavy horizontal accumulation shelves. The asset is printing a clear higher-low configuration, signaling that selling pressure is exhausting at major Fibonacci support levels.
Looking strictly at the precise technical geometry of the hourly chart:
1. Support Validation: The price is holding firm around the $1.1748 zone, actively defending the critical Fibonacci retracement floor [image_bLUbSi.png]. This structural cushion represents a high-confluence demand anchor where institutional buying interest is stepping back in.
2. Order Flow & Continuation: The market is currently consolidating, building local energy below structural overhead lines. A clean continuation past immediate micro-resistance will fully shift the short-term velocity back in alignment with the major impulse uptrend.
3. Invalidation Parameters: Risk parameters are structurally secure, with defensive coverage anchored beneath the absolute local swing floor to isolate the setup from any near-term liquidity-grab volatility.
🛠️ My Trading Plan (Upside Extensions):
• Entry Zone: Around $1.1748 (Positioning directly into the live stabilization base)
• Invalidation (Stop Loss): Placed strictly at $1.15 to safeguard core trading capital
• Target 1 (TP1): $1.24 (Immediate horizontal resistance shelf and near-term liquidity target)
• Target 2 (TP2): $1.29 (Primary swing target / High-volume supply boundary - Recommended)
• Target 3 (TP3): $1.34 (Major mathematical extension targeting previous local peaks)
What is your technical outlook on SUI as it builds a fresh structural floor above the Fibonacci grid? Let me know in the comments below, and don't forget to support this analysis with a boost!
*DISCLAIMER: This post is for educational and technical analysis purposes only. It does not constitute investment or financial advice. Always practice strict risk management.*
交易结束:到达目标

免责声明
这些信息和出版物并非旨在提供,也不构成TradingView提供或认可的任何形式的财务、投资、交易或其他类型的建议或推荐。请阅读使用条款了解更多信息。