SUSHIBTC is testing the weekly support
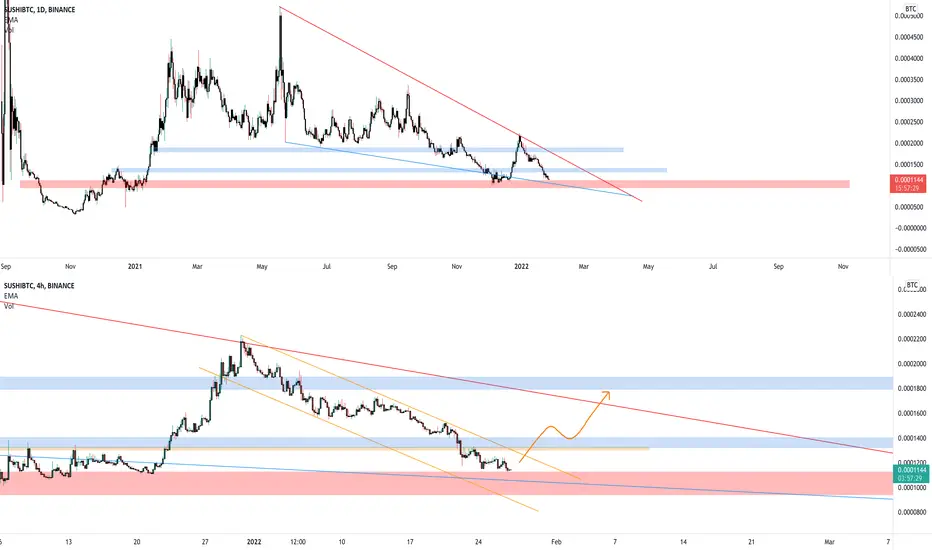
The price is testing the weekly support on 0.0011, it's a key level as you can see from the upper chart (Daily timeframe)
On the lower chart (4h timeframe) the market is creating a descending channel, and after the breakdown from the daily support, the market retested it as new resistance.
How to approach?
We need to wait for a breakout from the daily resistance and 4h Descending channel and if the market shift from bear to bull, we can add in our watchlist and wait for apply our rules for a new long position.
–––––
Follow the Shrimp 🦐
Keep in mind.
On the lower chart (4h timeframe) the market is creating a descending channel, and after the breakdown from the daily support, the market retested it as new resistance.
How to approach?
We need to wait for a breakout from the daily resistance and 4h Descending channel and if the market shift from bear to bull, we can add in our watchlist and wait for apply our rules for a new long position.
–––––
Follow the Shrimp 🦐
Keep in mind.
- 🟣 Purple structure -> Monthly structure.
- 🔴 Red structure -> Weekly structure.
- 🔵 Blue structure -> Daily structure.
- 🟡 Yellow structure -> 4h structure.

免责声明
这些信息和出版物并非旨在提供,也不构成TradingView提供或认可的任何形式的财务、投资、交易或其他类型的建议或推荐。请阅读使用条款了解更多信息。