
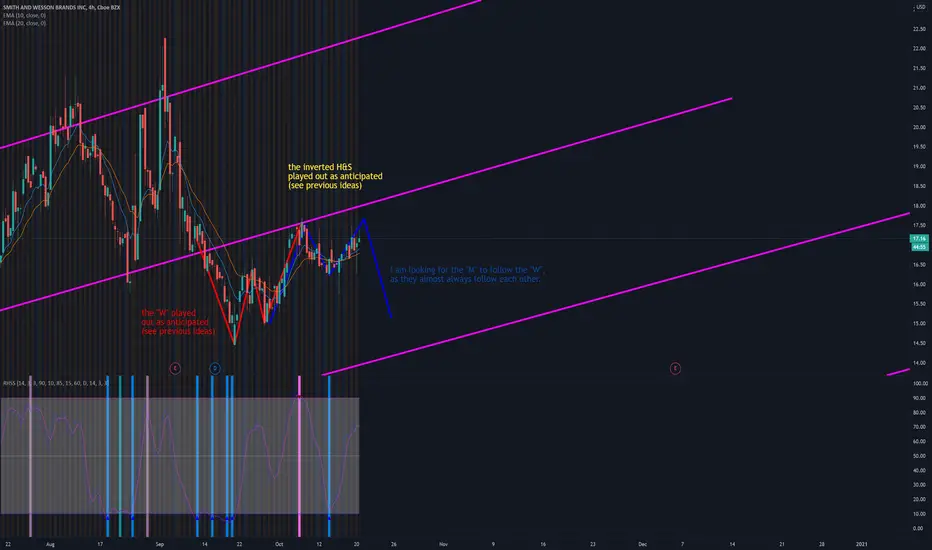
trading off the 10 & 20 EMAs, the daily is about to confirm the retest and signal an uptrend on the daily (green candle closing above the EMA cloud with the 10 over the 20) which could easily invalidate the idea published here: breaking down the right side of the blue "M".
If the "M" does play our as depicted, it will simply paint a larger "W" with an upside around $20, the resistance from our most recent major high.
If the "M" does play our as depicted, it will simply paint a larger "W" with an upside around $20, the resistance from our most recent major high.
交易结束:到达目标
the M ran to its bottom against the lower side of the current channel.
免责声明
这些信息和出版物并非旨在提供,也不构成TradingView提供或认可的任何形式的财务、投资、交易或其他类型的建议或推荐。请阅读使用条款了解更多信息。
免责声明
这些信息和出版物并非旨在提供,也不构成TradingView提供或认可的任何形式的财务、投资、交易或其他类型的建议或推荐。请阅读使用条款了解更多信息。