
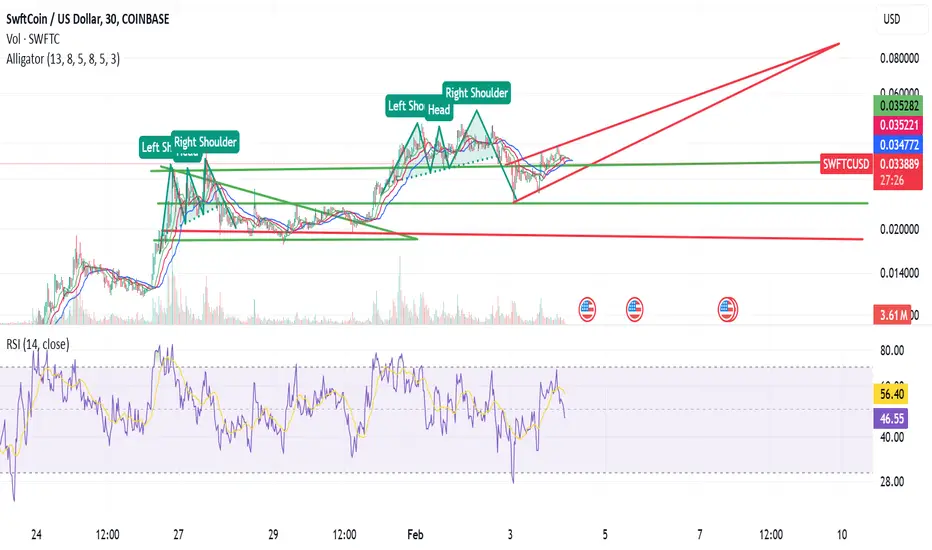
The rising wedge is a chart pattern used to identify possible reversals.
The pattern appears as an upward-sloping price channel featuring two converging trend lines.
It's usually accompanied by falling trading volume.
Wedges can either form in the rising or falling direction.
A rising wedge is often considered a bearish chart pattern, meaning it indicates a breakout to the downside.
Be careful of a shakeout-fake-out.
It appears as though an Ascending Triangle is hiding in the shadows.
It is very common for whales to accumulate at the bottom of these patterns..
glta
The pattern appears as an upward-sloping price channel featuring two converging trend lines.
It's usually accompanied by falling trading volume.
Wedges can either form in the rising or falling direction.
A rising wedge is often considered a bearish chart pattern, meaning it indicates a breakout to the downside.
Be careful of a shakeout-fake-out.
It appears as though an Ascending Triangle is hiding in the shadows.
It is very common for whales to accumulate at the bottom of these patterns..
glta

相关出版物
免责声明
这些信息和出版物并非旨在提供,也不构成TradingView提供或认可的任何形式的财务、投资、交易或其他类型的建议或推荐。请阅读使用条款了解更多信息。