
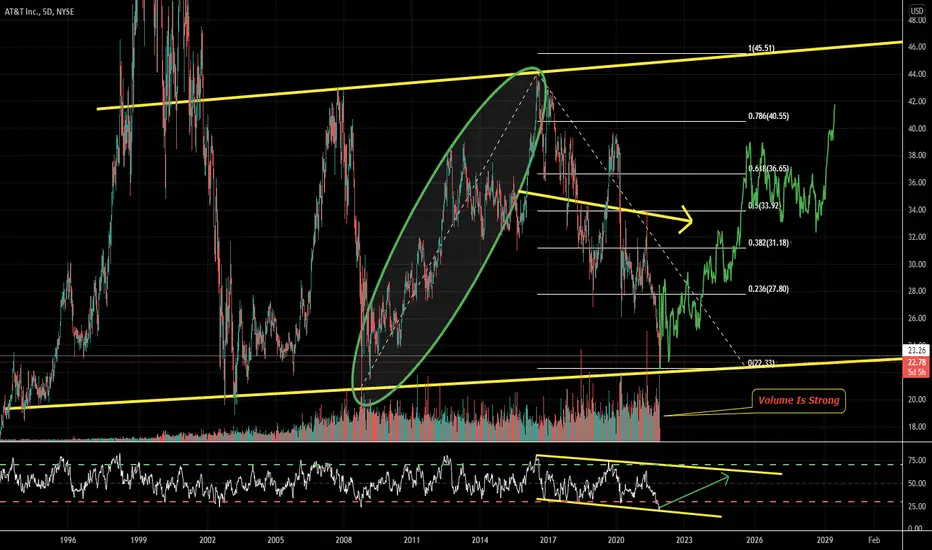
Quick Analysis on AT&T Inc (ATT) on a 5D Linear Chart.
1) The AT&T stock price is back to the 2008-2010 lows.
2) The RSI (relative strength index) has been hovering in the oversold region and met the bottom trendline.
3) In the chart, a fractal from the previous price increase is shown assuming price moves in the same direction.
4) A Trend Based Fibonacci Extension is also shown to give the reader areas to focus on.
5) The Volume is healthy.
6) The price has suffered over the past 10 years and now there may be a chance for it to go back up. Let's see!
What are your opinions on this?
If you enjoy my ideas, feel free to like it and drop in a comment. I love reading your comments below.
Disclosure: This is just my opinion and not any type of financial advice. I enjoy charting and discussing technical analysis. Don't trade based on my advice. Do your own research! #cryptopickk
1) The AT&T stock price is back to the 2008-2010 lows.
2) The RSI (relative strength index) has been hovering in the oversold region and met the bottom trendline.
3) In the chart, a fractal from the previous price increase is shown assuming price moves in the same direction.
4) A Trend Based Fibonacci Extension is also shown to give the reader areas to focus on.
5) The Volume is healthy.
6) The price has suffered over the past 10 years and now there may be a chance for it to go back up. Let's see!
What are your opinions on this?
If you enjoy my ideas, feel free to like it and drop in a comment. I love reading your comments below.
Disclosure: This is just my opinion and not any type of financial advice. I enjoy charting and discussing technical analysis. Don't trade based on my advice. Do your own research! #cryptopickk
注释
still a potential!注释
AT&T Update: RSI and Stoch RSI is overbought on the 1D and lower timeframes. Price is growing too fast. Be a bit careful.
相关出版物
免责声明
这些信息和出版物并非旨在提供,也不构成TradingView提供或认可的任何形式的财务、投资、交易或其他类型的建议或推荐。请阅读使用条款了解更多信息。