
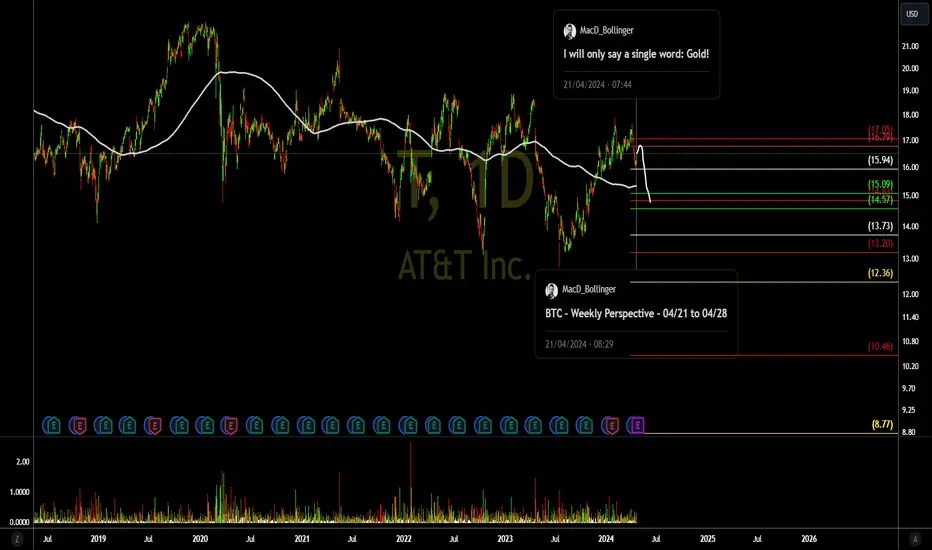
From the graph we have a great possibility. If prices do not overcome the 17.05 region we can see prices seeking first the long average (white line) and then the 15.09 and 14.83 bands (support).
For this to happen, prices must drop below 15.95, as shown below.

Resistances: 16.79 and 17.05.
Supports: 15.09 and 14.83.
The value of 14.83 is a possible target with the loss of the 15.94 region.
Do your analysis and good business.
Be aware, if you buy, use stop loss.
See other graphical analyzes below.
For this to happen, prices must drop below 15.95, as shown below.
Resistances: 16.79 and 17.05.
Supports: 15.09 and 14.83.
The value of 14.83 is a possible target with the loss of the 15.94 region.
Do your analysis and good business.
Be aware, if you buy, use stop loss.
See other graphical analyzes below.

相关出版物
免责声明
这些信息和出版物并非旨在提供,也不构成TradingView提供或认可的任何形式的财务、投资、交易或其他类型的建议或推荐。请阅读使用条款了解更多信息。