
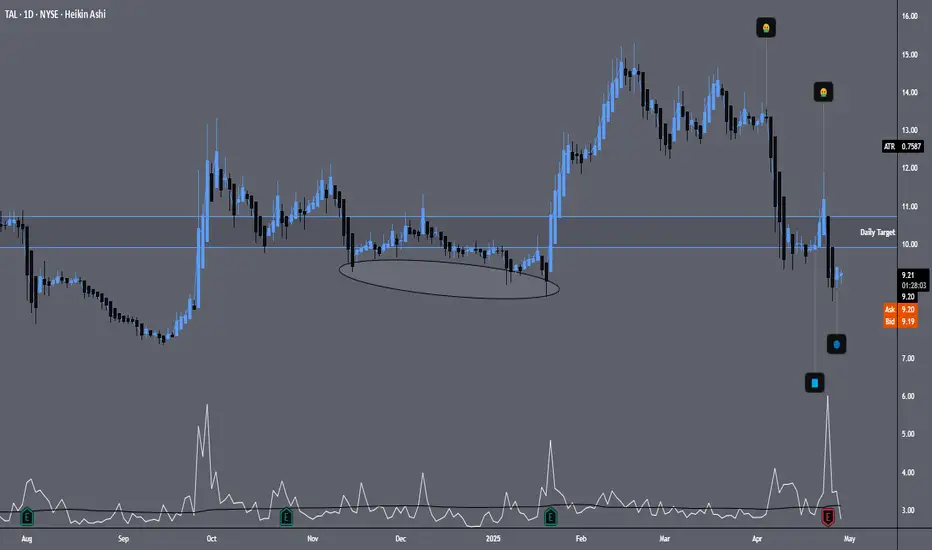
Looks like price is near a support zone dating back between November '24 - January '25. If we look at the two "throw up" emojis price shot down pretty sharp and price started to trade sideways (one on the left) then price retraced a bit before making a new local "potential" support zone if price settles here. Got a big bear volume spike on 4/24/25. Momentum is on a pause right now so I'm interested to see if we get bullish momentum coming in toward the target range located on the chart. If price goes lower, we will look for a second entry if opportunity presents itself.

免责声明
这些信息和出版物并非旨在提供,也不构成TradingView提供或认可的任何形式的财务、投资、交易或其他类型的建议或推荐。请阅读使用条款了解更多信息。
免责声明
这些信息和出版物并非旨在提供,也不构成TradingView提供或认可的任何形式的财务、投资、交易或其他类型的建议或推荐。请阅读使用条款了解更多信息。