
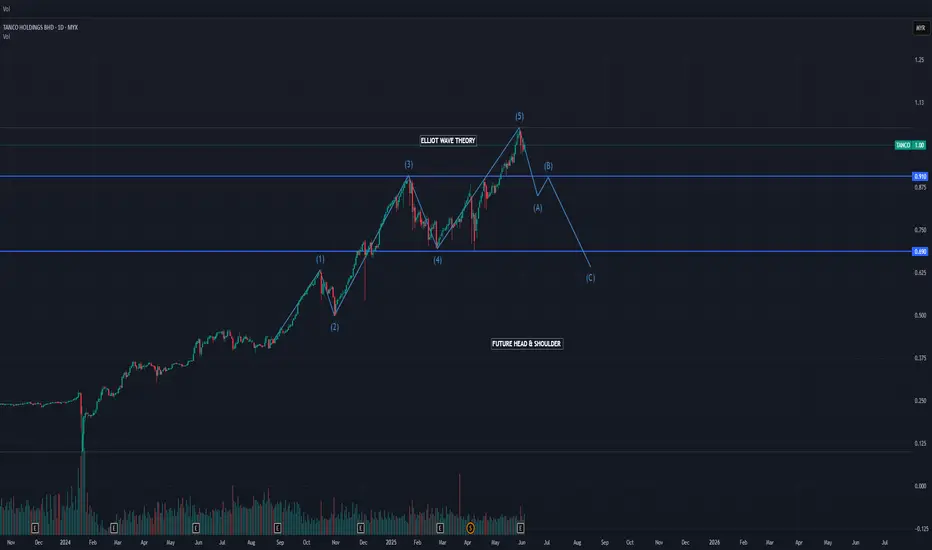
Elliott Wave Count - Impulsive Phase
Wave (1): Begins from the breakout in mid-2023, this early-stage portrays institutional accumulation.
Wave (2): A sharp corrective retracement—likely a zig-zag—testing the conviction of early entrants.
Wave (3): The strongest and most extended wave, characterized by increased volume and price acceleration (a classic signature of a third wave).
Wave (4): A complex sideways correction that found support near a previous resistance-turned-support zone.
Wave (5): Final leg up, shows signs of weakening momentum and potential exhaustion—divergences can likely be spotted on RSI or MACD.
Elliot Wave Correction Wave Phase
Wave (A): Initial sell-off that breaks the parabolic uptrend line—often fast and steep.
Wave (B): A deceptive bounce that retraces some of Wave A but typically lacks conviction.
Wave (C): A final capitulation leg, often equal or larger than Wave A in depth—projected to target RM0.69 area.
Chart pattern possible formation: Head & shoulders formation, with the neckline sitting approximately at RM0.69. This pattern often aligns with Wave C's completion and acts as a major structural pivot.
Wave (1): Begins from the breakout in mid-2023, this early-stage portrays institutional accumulation.
Wave (2): A sharp corrective retracement—likely a zig-zag—testing the conviction of early entrants.
Wave (3): The strongest and most extended wave, characterized by increased volume and price acceleration (a classic signature of a third wave).
Wave (4): A complex sideways correction that found support near a previous resistance-turned-support zone.
Wave (5): Final leg up, shows signs of weakening momentum and potential exhaustion—divergences can likely be spotted on RSI or MACD.
Elliot Wave Correction Wave Phase
Wave (A): Initial sell-off that breaks the parabolic uptrend line—often fast and steep.
Wave (B): A deceptive bounce that retraces some of Wave A but typically lacks conviction.
Wave (C): A final capitulation leg, often equal or larger than Wave A in depth—projected to target RM0.69 area.
Chart pattern possible formation: Head & shoulders formation, with the neckline sitting approximately at RM0.69. This pattern often aligns with Wave C's completion and acts as a major structural pivot.

免责声明
这些信息和出版物并非旨在提供,也不构成TradingView提供或认可的任何形式的财务、投资、交易或其他类型的建议或推荐。请阅读使用条款了解更多信息。
免责声明
这些信息和出版物并非旨在提供,也不构成TradingView提供或认可的任何形式的财务、投资、交易或其他类型的建议或推荐。请阅读使用条款了解更多信息。